- PA11,
- PA12
3D PA Polyamide Market is valued at USD x million in 2022 and is poised to grow at a CAGR of 39.9% from 2023 to 2029. The global market provides a detailed overview and market segmented by product by end-use. By type, the 3D PA polyamide market has been segmented into PA11 and PA12. The PA12 segment is likely the largest and fastest-growing in terms of styles. Based on end-use, the 3D PA polyamide is segmented into Healthcare, Aerospace & Defense, Automotive, Electronics, and Others. According to precision business insights, the Healthcare and Aerospace & Defense segment is predicted to register the fastest growth rate during the forecast period.
3d Pa Polyamide Market Summary
Study Period
2024-2030
Base Year
2023
CAGR
39.9%
Largest Market
Asia Pacific
Fastest Growing Market
Europe
3D PA Polyamide Market Dynamics
One of the primary factors driving the 3D PA (polyamide) market growth is its increasing use in the healthcare, aerospace, & military sectors for weight loss.
Key Features of the Reports
- The 3D PA polyamide market report provides granular level information about the market size, regional market share, historic market (2018-2022) and forecast (2023-2029)
- The 3D PA polyamide market report covers in-detail insights about the competitors overview, company share analysis, key market developments, and their key strategies
- The 3D PA polyamide market report outlines drivers, restraints, unmet needs, and trends that are currently affecting the market
- The 3D PA polyamide market report tracks recent innovations, key developments, and start-up details that are actively working in the market
- The 3D PA polyamide market report provides a plethora of information about market entry strategies, regulatory framework, and reimbursement scenario

3d Pa Polyamide Market Segmentation
By Product Type
By End User
- Healthcare,
- Aerospace & Defense,
- Automotive,
- Electronics,
- Others
By Geography
- North America,
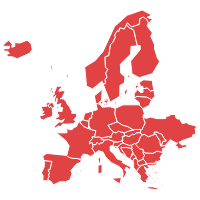
- Europe,
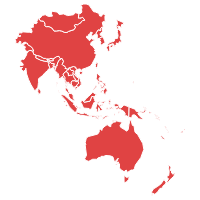
- Asia Pacific,
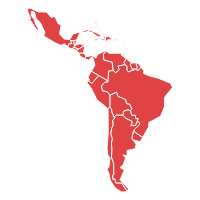
- Latin America and
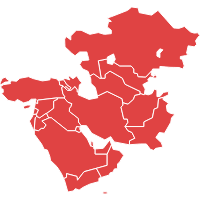
- Middle East and Africa
Frequently Asked Questions
The 3d pa polyamide market is projected to expand at a CAGR of 39.9% during the forecast period.
The global 3D PA polyamide market players are 3D Systems, Stratasys, Ltd., Evonik Industries AG, Arkema S.A., EOS GmbH, CRP Group, and Golden Plasticsa.
Europe is the fastest-growing region for zeolite market
| 1. Executive Summary |
| 2. Global 3D PA Polyamide Market Introduction |
| 2.1. Global 3D PA Polyamide Market Taxonomy |
| 2.2. Global 3D PA Polyamide Market Definitions |
| 2.2.1. Product |
| 2.2.2. End-Use |
| 3. Global 3D PA Polyamide Market Dynamics |
| 3.1. Drivers |
| 3.2. Restraints |
| 3.3. Opportunities/Unmet Needs of the Market |
| 3.4. Trends |
| 3.5. Global 3D PA Polyamide Market Dynamic Factors - Impact Analysis |
| 3.6. Global 3D PA Polyamide Market COVID Impact Analysis |
| 4. Global 3D PA Polyamide Market Analysis, 2018 - 2022 and Forecast, 2023 - 2029 |
| 4.1. Market Analysis, 2018 - 2022 and Forecast, 2023 - 2029 (Revenue, USD Mn) (Volume, Tonnes) |
| 4.2. Year-over-Year (Y-o-Y) Growth Analysis (%) |
| 4.3. Market Opportunity Analysis |
| 5. Global 3D PA Polyamide Market, By Product, 2018 - 2022 and Forecast, 2023 - 2029 (Revenue, USD Mn) (Volume, Tonnes) |
| 5.1. PA11 |
| 5.1.1. Market Analysis, 2018 - 2022 and Forecast, 2023 - 2029 (Revenue, USD Mn) (Volume, Tonnes) |
| 5.1.2. Year-over-Year (Y-o-Y) Growth Analysis (%) and Market Share Analysis (%) |
| 5.1.3. Market Opportunity Analysis |
| 5.2. PA12 |
| 5.2.1. Market Analysis, 2018 - 2022 and Forecast, 2023 - 2029 (Revenue, USD Mn) (Volume, Tonnes) |
| 5.2.2. Year-over-Year (Y-o-Y) Growth Analysis (%) and Market Share Analysis (%) |
| 5.2.3. Market Opportunity Analysis |
| 6. Global 3D PA Polyamide Market Forecast, By End-Use, 2018 - 2022 and Forecast, 2023 - 2029 |
| 6.1. Healthcare |
| 6.1.1. Market Analysis, 2018 - 2022 and Forecast, 2023 - 2029 (Revenue, USD Mn) (Volume, Tonnes) |
| 6.1.2. Year-over-Year (Y-o-Y) Growth Analysis (%) and Market Share Analysis (%) |
| 6.1.3. Market Opportunity Analysis |
| 6.2. Aerospace & Defense |
| 6.2.1. Market Analysis, 2018 - 2022 and Forecast, 2023 - 2029 (Revenue, USD Mn) (Volume, Tonnes) |
| 6.2.2. Year-over-Year (Y-o-Y) Growth Analysis (%) and Market Share Analysis (%) |
| 6.2.3. Market Opportunity Analysis |
| 6.3. Automotive |
| 6.3.1. Market Analysis, 2018 - 2022 and Forecast, 2023 - 2029 (Revenue, USD Mn) (Volume, Tonnes) |
| 6.3.2. Year-over-Year (Y-o-Y) Growth Analysis (%) and Market Share Analysis (%) |
| 6.3.3. Market Opportunity Analysis |
| 6.4. Electronics |
| 6.4.1. Market Analysis, 2018 - 2022 and Forecast, 2023 - 2029 (Revenue, USD Mn) (Volume, Tonnes) |
| 6.4.2. Year-over-Year (Y-o-Y) Growth Analysis (%) and Market Share Analysis (%) |
| 6.4.3. Market Opportunity Analysis |
| 6.5. Others |
| 6.5.1. Market Analysis, 2018 - 2022 and Forecast, 2023 - 2029 (Revenue, USD Mn) (Volume, Tonnes) |
| 6.5.2. Year-over-Year (Y-o-Y) Growth Analysis (%) and Market Share Analysis (%) |
| 6.5.3. Market Opportunity Analysis |
| 7. Global 3D PA Polyamide Market Forecast, By Region, 2018 - 2022 and Forecast, 2023 - 2029 (Revenue, USD Mn) (Volume, Tonnes) |
| 7.1. North America |
| 7.1.1. Market Analysis, 2018 - 2022 and Forecast, 2023 - 2029 (Revenue, USD Mn) (Volume, Tonnes) |
| 7.1.2. Year-over-Year (Y-o-Y) Growth Analysis (%) and Market Share Analysis (%) |
| 7.1.3. Market Opportunity Analysis |
| 7.2. Europe |
| 7.2.1. Market Analysis, 2018 - 2022 and Forecast, 2023 - 2029 (Revenue, USD Mn) (Volume, Tonnes) |
| 7.2.2. Year-over-Year (Y-o-Y) Growth Analysis (%) and Market Share Analysis (%) |
| 7.2.3. Market Opportunity Analysis |
| 7.3. Asia-Pacific |
| 7.3.1. Market Analysis, 2018 - 2022 and Forecast, 2023 - 2029 (Revenue, USD Mn) (Volume, Tonnes) |
| 7.3.2. Year-over-Year (Y-o-Y) Growth Analysis (%) and Market Share Analysis (%) |
| 7.3.3. Market Opportunity Analysis |
| 7.4. Latin America |
| 7.4.1. Market Analysis, 2018 - 2022 and Forecast, 2023 - 2029 (Revenue, USD Mn) (Volume, Tonnes) |
| 7.4.2. Year-over-Year (Y-o-Y) Growth Analysis (%) and Market Share Analysis (%) |
| 7.4.3. Market Opportunity Analysis |
| 7.5. Middle East and Africa |
| 7.5.1. Market Analysis, 2018 - 2022 and Forecast, 2023 - 2029 (Revenue, USD Mn) (Volume, Tonnes) |
| 7.5.2. Year-over-Year (Y-o-Y) Growth Analysis (%) and Market Share Analysis (%) |
| 7.5.3. Market Opportunity Analysis |
| 7.6. Global 3D PA Polyamide Market - Opportunity Analysis Index, By Product, End-Use, and Region, 2023 - 2029 |
| 8. North America 3D PA Polyamide Market Analysis, 2018 - 2022 and Forecast, 2023 - 2029 (Revenue, USD Mn) (Volume, Tonnes) |
| 8.1. Product Analysis 2018 - 2022 and Forecast 2021 2027 by Revenue (USD Mn), Volume (Tonnes), Y-o-Y Growth (%), and Market Share (%) |
| 8.1.1. PA11 |
| 8.1.2. PA12 |
| 8.2. End-Use Analysis 2018 - 2022 and Forecast 2023 - 2029 by Revenue (USD Mn), Y-o-Y Growth (%) and Market Share (%) |
| 8.2.1. Healthcare |
| 8.2.2. Aerospace & Defense |
| 8.2.3. Automotive |
| 8.2.4. Electronics |
| 8.2.5. Others |
| 8.3. Country Analysis 2018 - 2022 and Forecast 2021 2027 by Revenue (USD Mn), Volume (Tonnes), Y-o-Y Growth (%), and Market Share (%) |
| 8.3.1. USA |
| 8.3.2. Canada |
| 8.4. North America 3D PA Polyamide Market - Opportunity Analysis Index, By Product, End-Use, and Country, 2023 - 2029 |
| 8.5. North America 3D PA Polyamide Market Dynamics Trends |
| 9. Europe 3D PA Polyamide Market Analysis, 2018 - 2022 and Forecast, 2023 - 2029 (Revenue, USD Mn) (Volume, Tonnes) |
| 9.1. Product Analysis 2018 - 2022 and Forecast 2021 2027 by Revenue (USD Mn), Volume (Tonnes), Y-o-Y Growth (%), and Market Share (%) |
| 9.1.1. PA11 |
| 9.1.2. PA12 |
| 9.2. End-Use Analysis 2018 - 2022 and Forecast 2023 - 2029 by Revenue (USD Mn), Y-o-Y Growth (%) and Market Share (%) |
| 9.2.1. Healthcare |
| 9.2.2. Aerospace & Defense |
| 9.2.3. Automotive |
| 9.2.4. Electronics |
| 9.2.5. Others |
| 9.3. Country Analysis 2018 - 2022 and Forecast 2023 - 2029 by Revenue (USD Mn), Volume (Tonnes), Y-o-Y Growth (%), and Market Share (%) |
| 9.3.1. Germany |
| 9.3.2. UK |
| 9.3.3. France |
| 9.3.4. Spain |
| 9.3.5. Italy |
| 9.3.6. Russia |
| 9.3.7. Poland |
| 9.3.8. Rest of Europe |
| 9.4. Europe 3D PA Polyamide Market - Opportunity Analysis Index, By Product, End-Use, and Country, 2023 - 2029 |
| 9.5. Europe 3D PA Polyamide Market Dynamics Trends |
| 10. Asia-Pacific 3D PA Polyamide Market Analysis, 2018 - 2022 and Forecast, 2023 - 2029 (Revenue, USD Mn) (Volume, Tonnes) |
| 10.1. Product Analysis 2018 - 2022 and Forecast 2021 2027 by Revenue (USD Mn), Volume (Tonnes), Y-o-Y Growth (%), and Market Share (%) |
| 10.1.1. PA11 |
| 10.1.2. PA12 |
| 10.2. End-Use Analysis 2018 - 2022 and Forecast 2023 - 2029 by Revenue (USD Mn), Y-o-Y Growth (%) and Market Share (%) |
| 10.2.1. Healthcare |
| 10.2.2. Aerospace & Defense |
| 10.2.3. Automotive |
| 10.2.4. Electronics |
| 10.2.5. Others |
| 10.3. Country Analysis 2018 - 2022 and Forecast 2023 - 2029 by Revenue (USD Mn), Volume (Tonnes), Y-o-Y Growth (%), and Market Share (%) |
| 10.3.1. Japan |
| 10.3.2. China |
| 10.3.3. India |
| 10.3.4. ASEAN |
| 10.3.5. Australia & New Zealand |
| 10.3.6. Rest of Asia-Pacific |
| 10.4. Asia-Pacific 3D PA Polyamide Market - Opportunity Analysis Index, By Product, End-Use, and Country, 2023 - 2029 |
| 10.5. Asia-Pacific 3D PA Polyamide Market Dynamics Trends |
| 11. Latin America 3D PA Polyamide Market Analysis, 2018 - 2022 and Forecast, 2023 - 2029 (Revenue, USD Mn) (Volume, Tonnes) |
| 11.1. Product Analysis 2018 - 2022 and Forecast 2021 2027 by Revenue (USD Mn), Volume (Tonnes), Y-o-Y Growth (%), and Market Share (%) |
| 11.1.1. PA11 |
| 11.1.2. PA12 |
| 11.2. End-Use Analysis 2018 - 2022 and Forecast 2023 - 2029 by Revenue (USD Mn), Y-o-Y Growth (%) and Market Share (%) |
| 11.2.1. Healthcare |
| 11.2.2. Aerospace & Defense |
| 11.2.3. Automotive |
| 11.2.4. Electronics |
| 11.2.5. Others |
| 11.3. Country Analysis 2018 - 2022 and Forecast 2023 - 2029 by Revenue (USD Mn), Volume (Tonnes), Y-o-Y Growth (%), and Market Share (%) |
| 11.3.1. Brazil |
| 11.3.2. Mexico |
| 11.3.3. Argentina |
| 11.3.4. Rest of Latin America |
| 11.4. Latin America 3D PA Polyamide Market - Opportunity Analysis Index, By Product, End-Use, and Country, 2023 - 2029 |
| 11.5. Latin America 3D PA Polyamide Market Dynamics Trends |
| 12. Middle East and Africa (MEA) 3D PA Polyamide Market Analysis, 2018 - 2022 and Forecast, 2023 - 2029 (Revenue, USD Mn) (Volume, Tonnes) |
| 12.1. Product Analysis 2018 - 2022 and Forecast 2021 2027 by Revenue (USD Mn), Volume (Tonnes), Y-o-Y Growth (%), and Market Share (%) |
| 12.1.1. PA11 |
| 12.1.2. PA12 |
| 12.2. End-Use Analysis 2018 - 2022 and Forecast 2023 - 2029 by Revenue (USD Mn), Y-o-Y Growth (%) and Market Share (%) |
| 12.2.1. Healthcare |
| 12.2.2. Aerospace & Defense |
| 12.2.3. Automotive |
| 12.2.4. Electronics |
| 12.2.5. Others |
| 12.3. Country Analysis 2018 - 2022 and Forecast 2023 - 2029 by Revenue (USD Mn), Volume (Tonnes), Y-o-Y Growth (%), and Market Share (%) |
| 12.3.1. Gulf Cooperation Council (GCC) Countries |
| 12.3.2. Israel |
| 12.3.3. South Africa |
| 12.3.4. Rest of MEA |
| 12.4. MEA 3D PA Polyamide Market - Opportunity Analysis Index, By Product, End-Use, and Country, 2023 - 2029 |
| 12.5. MEA 3D PA Polyamide Market Dynamics Trends |
| 13. Competition Landscape |
| 13.1. Strategic Dashboard of Top Market Players |
| 13.2. Company Profiles (Introduction, Financial Analysis, End-Use& Service Offerings, Key Developments, Strategies, and SWOT Analysis) |
| 13.2.1. 3D Systems |
| 13.2.2. Stratasys, Ltd. |
| 13.2.3. Evonik Industries AG |
| 13.2.4. Arkema S.A. |
| 13.2.5. EOS GmbH |
| 13.2.6. CRP Group |
| 13.2.7. Golden Plastics |
| 14. Research Methodology |
| 15. Key Assumptions and Acronyms |
- 3D Systems
- Stratasys, Ltd.
- Evonik Industries AG
- Arkema S.A.
- EOS GmbH
- CRP Group
- Golden Plasticsa
