- Peonidin
- Cyanidin
- Delphinidin
- Malvidin
- Others
Anthocyanins Market size was valued at USD 335.90 million in 2023 and is expected to reach USD 490.83 million by 2030, at a CAGR of 5.0% from 2024-2030. Anthocyanins are water-soluble vacuolar pigments which may appear red, blue, or purple depending on their pH. Various food plants are rich in anthocyanins, which include black soybean, black rice, blueberry, and raspberry. Anthocyanins belong to the class of molecules known as flavonoids. Anthocyanin is a flavonoid that is a sort of vegetable-based pigment that is used as a natural colourant in a range of industries. It has no taste or flavour and comes in a variety of colours ranging from red to purple to blue. Anthocyanin is a water-soluble pigment used mostly in the food and beverage industry as a colourant. Anthocyanin is a type of antioxidant that offers a lot of health benefits. this report studies global Market dynamics elaborately to identify the current trends & drivers, future opportunities and possible challenges to the key stakeholders operating in the market. In addition, The global Anthocyanins Market report includes human demographics; regulatory scenario, and competition analysis with a vividly illustrated competition dashboard to assess the market competition. Moreover, PBI analyzed the global Anthocyanins Market to better equip clients with possible investment opportunities across the regions (regional Investment hot spots) and market unmet needs (Product opportunities).
Anthocyanins Market Summary
Study Period
2024-2030
Base Year
2023
CAGR
5.0%
Largest Market
Asia-Pacific
Fastest Growing Market
Europe
Anthocyanins Market Dynamics
An growth in the demand for trustworthy food goods could also drive anthocyanin demand in the next seven years. There are efforts underway to shift consumer preferences toward healthy and appealing group foods and beverages in order to encourage the development of natural product concentrates. Anti-oxidant, neuroprotective, and anti-malignant growth qualities of anthocyanins have made them appropriate for usage in pharmaceutical goods. As a result, anthocyanin demand in the social insurance sector has increased dramatically in recent years, making the pharmaceutical business one of the most important supporters of the worldwide anthocyanin market's expansion.
Key Features of the Reports
- The report provides granular level information about the market size, regional market share, historic market (2019-2023), and forecast (2024-2030)
- The report covers in-detail insights about the competitor’s overview, company share analysis, key market developments, and their key strategies
- The report outlines drivers, restraints, unmet needs, and trends that are currently affecting the market
- The report tracks recent innovations, key developments, and start-up details that are actively working in the market
- The report provides a plethora of information about market entry strategies, regulatory framework, and reimbursement scenario

Anthocyanins Market Segmentation
By Type
By Application
- Pharmaceutical Products
- Personal Care Products
- Food and Beverage
- Others
Frequently Asked Questions
The mexico fiber optics market size was valued at USD 335.90 million in 2023
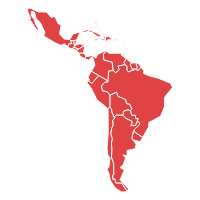
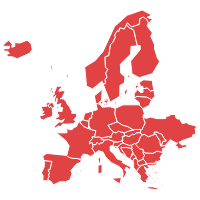
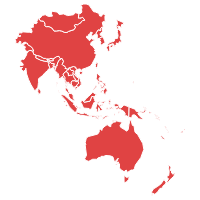
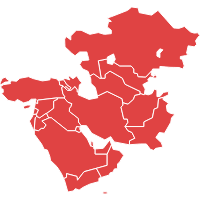
The report covers the five regions and 15+ countries market data: North America (United States, Canada), Europe (Germany, France, Italy, Spain, and United Kingdom (UK), Asia Pacific (China, India, Japan, Australia & New Zealand), Latin America (Brazil, Mexico, Argentina) and Middle East and Africa (Saudi Arabia, United Arab Emirates, South Africa).
In our report, we provide 12-15 market players’ information into the report. However, based on the client’s request we will provide additional country and regional market players information as well.
| 1. Executive Summary |
| 2. Global Anthocyanins Market Introduction |
| 2.1. Global Anthocyanins Market – Taxonomy |
| 2.2. Global Anthocyanins Market – Definitions |
| 2.2.1. Type |
| 2.2.2. Application |
| 3. Global Anthocyanins Market Dynamics |
| 3.1. Drivers |
| 3.2. Restraints |
| 3.3. Opportunities/Unmet Needs of the Market |
| 3.4. Trends |
| 3.5. Global Anthocyanins Market Dynamic Factors - Impact Analysis |
| 3.6. Global Anthocyanins Market – Competition Landscape |
| 3.7. Epidemiology |
| 4. Global Anthocyanins Market Analysis, 2019 - 2023 and Forecast, 2024 - 2030 |
| 4.1. Market Analysis, 2019 - 2023 and Forecast, 2024 - 2030 (Revenue, USD Mn) |
| 4.2. Year-over-Year (Y-o-Y) Growth Analysis (%) |
| 4.3. Market Opportunity Analysis |
| 5. Global Anthocyanins Market, By Type, 2019 - 2023 and Forecast, 2024 - 2030 (Revenue, USD Mn) |
| 5.1. Peonidin |
| 5.1.1. Market Analysis, 2019 - 2023 and Forecast, 2024 - 2030 (Revenue, USD Mn) |
| 5.1.2. Year-over-Year (Y-o-Y) Growth Analysis (%) and Market Share Analysis (%) |
| 5.1.3. Market Opportunity Analysis |
| 5.2. Cyanidin |
| 5.2.1. Market Analysis, 2019 - 2023 and Forecast, 2024 - 2030 (Revenue, USD Mn) |
| 5.2.2. Year-over-Year (Y-o-Y) Growth Analysis (%) and Market Share Analysis (%) |
| 5.2.3. Market Opportunity Analysis |
| 5.3. Delphinidin |
| 5.3.1. Market Analysis, 2019 - 2023 and Forecast, 2024 - 2030 (Revenue, USD Mn) |
| 5.3.2. Year-over-Year (Y-o-Y) Growth Analysis (%) and Market Share Analysis (%) |
| 5.3.3. Market Opportunity Analysis |
| 5.4. Malvidin |
| 5.4.1. Market Analysis, 2019 - 2023 and Forecast, 2024 - 2030 (Revenue, USD Mn) |
| 5.4.2. Year-over-Year (Y-o-Y) Growth Analysis (%) and Market Share Analysis (%) |
| 5.4.3. Market Opportunity Analysis |
| 5.5. Others |
| 5.5.1. Market Analysis, 2019 - 2023 and Forecast, 2024 - 2030 (Revenue, USD Mn) |
| 5.5.2. Year-over-Year (Y-o-Y) Growth Analysis (%) and Market Share Analysis (%) |
| 5.5.3. Market Opportunity Analysis |
| 6. Global Anthocyanins Market Forecast, By Application, 2019 - 2023 and Forecast, 2024 - 2030 |
| 6.1. Pharmaceutical Products |
| 6.1.1. Market Analysis, 2019 - 2023 and Forecast, 2024 - 2030 (Revenue, USD Mn) |
| 6.1.2. Year-over-Year (Y-o-Y) Growth Analysis (%) and Market Share Analysis (%) |
| 6.1.3. Market Opportunity Analysis |
| 6.2. Personal Care Products |
| 6.2.1. Market Analysis, 2019 - 2023 and Forecast, 2024 - 2030 (Revenue, USD Mn) |
| 6.2.2. Year-over-Year (Y-o-Y) Growth Analysis (%) and Market Share Analysis (%) |
| 6.2.3. Market Opportunity Analysis |
| 6.3. Food and Beverage |
| 6.3.1. Market Analysis, 2019 - 2023 and Forecast, 2024 - 2030 (Revenue, USD Mn) |
| 6.3.2. Year-over-Year (Y-o-Y) Growth Analysis (%) and Market Share Analysis (%) |
| 6.3.3. Market Opportunity Analysis |
| 6.4. Others |
| 6.4.1. Market Analysis, 2019 - 2023 and Forecast, 2024 - 2030 (Revenue, USD Mn) |
| 6.4.2. Year-over-Year (Y-o-Y) Growth Analysis (%) and Market Share Analysis (%) |
| 6.4.3. Market Opportunity Analysis |
| 7. Global Anthocyanins Market Forecast, By Region, 2019 - 2023 and Forecast, 2024 - 2030 (Revenue, USD Mn) |
| 7.1. North America |
| 7.1.1. Market Analysis, 2019 - 2023 and Forecast, 2024 - 2030 (Revenue, USD Mn) |
| 7.1.2. Year-over-Year (Y-o-Y) Growth Analysis (%) and Market Share Analysis (%) |
| 7.1.3. Market Opportunity Analysis |
| 7.2. Europe |
| 7.2.1. Market Analysis, 2019 - 2023 and Forecast, 2024 - 2030 (Revenue, USD Mn) |
| 7.2.2. Year-over-Year (Y-o-Y) Growth Analysis (%) and Market Share Analysis (%) |
| 7.2.3. Market Opportunity Analysis |
| 7.3. Asia-Pacific |
| 7.3.1. Market Analysis, 2019 - 2023 and Forecast, 2024 - 2030 (Revenue, USD Mn) |
| 7.3.2. Year-over-Year (Y-o-Y) Growth Analysis (%) and Market Share Analysis (%) |
| 7.3.3. Market Opportunity Analysis |
| 7.4. Latin America |
| 7.4.1. Market Analysis, 2019 - 2023 and Forecast, 2024 - 2030 (Revenue, USD Mn) |
| 7.4.2. Year-over-Year (Y-o-Y) Growth Analysis (%) and Market Share Analysis (%) |
| 7.4.3. Market Opportunity Analysis |
| 7.5. Middle East and Africa |
| 7.5.1. Market Analysis, 2019 - 2023 and Forecast, 2024 - 2030 (Revenue, USD Mn) |
| 7.5.2. Year-over-Year (Y-o-Y) Growth Analysis (%) and Market Share Analysis (%) |
| 7.5.3. Market Opportunity Analysis |
| 7.6. Global Anthocyanins Market - Opportunity Analysis Index, By Type, By Application, and Region, 2024 - 2030 |
| 8. North America Anthocyanins Market Analysis, 2019 - 2023 and Forecast, 2024 - 2030 (Revenue, USD Mn) |
| 8.1. Type Analysis 2019 - 2023 and Forecast 2024 - 2030 by Revenue (USD Mn), Y-o-Y Growth (%), and Market Share (%) |
| 8.1.1. Peonidin |
| 8.1.2. Cyanidin |
| 8.1.3. Delphinidin |
| 8.1.4. Malvidin |
| 8.1.5. Others |
| 8.2. Application Analysis 2019 - 2023 and Forecast 2024 - 2030 by Revenue (USD Mn), Y-o-Y Growth (%), and Market Share (%) |
| 8.2.1. Pharmaceutical Products |
| 8.2.2. Personal Care Products |
| 8.2.3. Food and Beverage |
| 8.2.4. Others |
| 8.3. Country Analysis 2016 and Forecast 2024 - 2030 by Revenue (USD Mn), Y-o-Y Growth (%), and Market Share (%) |
| 8.3.1. U.S. |
| 8.3.2. Canada |
| 8.4. North America Anthocyanins Market - Opportunity Analysis Index, By Type, By Application, and Country, 2024 - 2030 |
| 8.5. North America Anthocyanins Market Dynamics – Trends |
| 9. Europe Anthocyanins Market Analysis, 2019 - 2023 and Forecast, 2024 - 2030 (Revenue, USD Mn) |
| 9.1. Type Analysis 2019 - 2023 and Forecast 2024 - 2030 by Revenue (USD Mn), Y-o-Y Growth (%), and Market Share (%) |
| 9.1.1. Peonidin |
| 9.1.2. Cyanidin |
| 9.1.3. Delphinidin |
| 9.1.4. Malvidin |
| 9.1.5. Others |
| 9.2. Application Analysis 2019 - 2023 and Forecast 2024 - 2030 by Revenue (USD Mn), Y-o-Y Growth (%), and Market Share (%) |
| 9.2.1. Pharmaceutical Products |
| 9.2.2. Personal Care Products |
| 9.2.3. Food and Beverage |
| 9.2.4. Others |
| 9.3. Country Analysis 2019 - 2023 and Forecast 2024 - 2030 by Revenue (USD Mn), Y-o-Y Growth (%), and Market Share (%) |
| 9.3.1. Germany |
| 9.3.2. UK |
| 9.3.3. France |
| 9.3.4. Spain |
| 9.3.5. Italy |
| 9.3.6. Russia |
| 9.3.7. Poland |
| 9.3.8. Rest of Europe |
| 9.4. Europe Anthocyanins Market - Opportunity Analysis Index, By Type, By Application, and Country, 2024 - 2030 |
| 9.5. Europe Anthocyanins Market Dynamics – Trends |
| 10. Asia-Pacific Anthocyanins Market Analysis, 2019 - 2023 and Forecast, 2024 - 2030 (Revenue, USD Mn) |
| 10.1. Type Analysis 2019 - 2023 and Forecast 2024 - 2030 by Revenue (USD Mn), Y-o-Y Growth (%), and Market Share (%) |
| 10.1.1. Peonidin |
| 10.1.2. Cyanidin |
| 10.1.3. Delphinidin |
| 10.1.4. Malvidin |
| 10.1.5. Others |
| 10.2. Application Analysis 2019 - 2023 and Forecast 2024 - 2030 by Revenue (USD Mn), Y-o-Y Growth (%), and Market Share (%) |
| 10.2.1. Pharmaceutical Products |
| 10.2.2. Personal Care Products |
| 10.2.3. Food and Beverage |
| 10.2.4. Others |
| 10.3. Country Analysis 2019 - 2023 and Forecast 2024 - 2030 by Revenue (USD Mn), Y-o-Y Growth (%), and Market Share (%) |
| 10.3.1. Japan |
| 10.3.2. China |
| 10.3.3. India |
| 10.3.4. ASEAN |
| 10.3.5. Australia & New Zealand |
| 10.3.6. Rest of Asia-Pacific |
| 10.4. Asia-Pacific Anthocyanins Market - Opportunity Analysis Index, By Type, By Application, and Country, 2024 - 2030 |
| 10.5. Asia-Pacific Anthocyanins Market Dynamics – Trends |
| 11. Latin America Anthocyanins Market Analysis, 2019 - 2023 and Forecast, 2024 - 2030 (Revenue, USD Mn) |
| 11.1. Type Analysis 2019 - 2023 and Forecast 2024 - 2030 by Revenue (USD Mn), Y-o-Y Growth (%), and Market Share (%) |
| 11.1.1. Peonidin |
| 11.1.2. Cyanidin |
| 11.1.3. Delphinidin |
| 11.1.4. Malvidin |
| 11.1.5. Others |
| 11.2. Application Analysis 2019 - 2023 and Forecast 2024 - 2030 by Revenue (USD Mn), Y-o-Y Growth (%), and Market Share (%) |
| 11.2.1. Pharmaceutical Products |
| 11.2.2. Personal Care Products |
| 11.2.3. Food and Beverage |
| 11.2.4. Others |
| 11.3. Country Analysis 2019 - 2023 and Forecast 2024 - 2030 by Revenue (USD Mn), Y-o-Y Growth (%), and Market Share (%) |
| 11.3.1. Brazil |
| 11.3.2. Mexico |
| 11.3.3. Argentina |
| 11.3.4. Venezuela |
| 11.3.5. Rest of Latin America |
| 11.4. Latin America Anthocyanins Market - Opportunity Analysis Index, By Type, By Application, and Country, 2024 - 2030 |
| 11.5. Latin America Anthocyanins Market Dynamics – Trends |
| 12. Middle East and Africa Anthocyanins Market Analysis, 2019 - 2023 and Forecast, 2024 - 2030 (Revenue, USD Mn) |
| 12.1. Type Analysis 2019 - 2023 and Forecast 2024 - 2030 by Revenue (USD Mn), Y-o-Y Growth (%), and Market Share (%) |
| 12.1.1. Peonidin |
| 12.1.2. Cyanidin |
| 12.1.3. Delphinidin |
| 12.1.4. Malvidin |
| 12.1.5. Others |
| 12.2. Application Analysis 2019 - 2023 and Forecast 2024 - 2030 by Revenue (USD Mn), Y-o-Y Growth (%), and Market Share (%) |
| 12.2.1. Pharmaceutical Products |
| 12.2.2. Personal Care Products |
| 12.2.3. Food and Beverage |
| 12.2.4. Others |
| 12.3. Country Analysis 2019 - 2023 and Forecast 2024 - 2030 by Revenue (USD Mn), Y-o-Y Growth (%), and Market Share (%) |
| 12.3.1. Gulf Cooperation Council (GCC) Countries |
| 12.3.2. Israel |
| 12.3.3. South Africa |
| 12.3.4. Rest of MEA |
| 12.4. MEA Anthocyanins Market - Opportunity Analysis Index, By Type, By Application, and Country, 2024 - 2030 |
| 12.5. MEA Anthocyanins Market Dynamics – Trends |
| 13. Competition Landscape |
| 13.1. Strategic Dashboard of Top Market Players |
| 13.2. Company Profiles (Introduction, Financial Analysis, Type& Service Offerings, Key Developments, Strategies, and SWOT Analysis) |
| 13.2.1. Kalsec Inc. (U.S) |
| 13.2.2. FMC Corporation (U.S) |
| 13.2.3. Synthite Industries (India) |
| 13.2.4. GNT Group (Netherlands) |
| 13.2.5. Archer Daniels Midlands Co (U.S) |
| 13.2.6. Symrise A.G. (Germany) |
| 13.2.7. Naturex S.A. (France) |
| 13.2.8. CHR Hansen A/S (Denmark) |
| 13.2.9. Sensient Technologies Corp (U.S) |
| 13.2.10. D. Williamson and Co. Inc. (U.S) |
| 14. Research Methodology |
| 15. Key Assumptions and Acronyms |
- Kalsec Inc. (U.S)
- FMC Corporation (U.S)
- Synthite Industries (India)
- GNT Group (Netherlands)
- Archer Daniels Midlands Co (U.S)
- Symrise A.G. (Germany)
- Naturex S.A. (France)
- CHR Hansen A/S (Denmark)
- Sensient Technologies Corp (U.S)
- D. Williamson and Co. Inc. (U.S)
