- Creams
- Body Butter
- Lotions
- Serum
- Massage Oil
- Others
Anti-Stretch Mark Products Market size was expected to be valued at USD 1,534.6 million in 2022 and is expected to grow at a CAGR of 5.5% in 2023-2029. Stretch marks are types of scars that arise on different body parts when the skin gets strained or contracts effortlessly. In addition, stretch marks are commonly seen in pregnant women and people suffering from obesity. Generally, there are numerous treatments accessible in the market that is anticipated to assist in the elimination of different stretch marks. Anti-stretch mark products refer to inorganic and organic formulations used over the skin to lessen the presence of marks and scars on the abdomen, hips, breasts, and other body parts. These products recover elasticity and increase collagen production. The increasing preference for topical skin treatments at home can lead to the anti-stretch mark product market growth. Moreover, high costs related to stretch mark removal processes such as microdermabrasion and lasers and easily accessible online retail networks that display a wide range of product portfolios are some primary factors that can boost the global anti-stretch mark products market.
Apart from these, the increasing prevalence of obesity treatment and growing beauty consciousness among people can also accelerate the market in the future. An increasing number of pregnant women can also drive the global market further. However, some factors such as side effects of anti-stretch marks removal products and stringent regulations imposed by the government to control the use of harmful chemicals on the skin can restrain the growth of the market. Companies should focus on producing products with advanced ingredients that can create an opportunity for the global anti-stretch mark products market growth.
Anti-Stretch Mark Products Market Key Developments:
- In February 2021, Dermaclara launched silicone fusion stretch mark patches and a kit, which are utilized to stimulate collagen regulation and decrease stretch marks during and post-pregnancy.
- In August 2021, StriVectin was acquired by Crown Laboratories to develop more skincare products.
Anti Stretch Mark Products Market Summary
Study Period
2024-2030
Base Year
2023
CAGR
5.5%
Largest Market
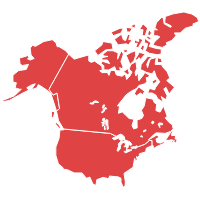
North American
Fastest Growing Market
Asia-Pacific
Anti-Stretch Mark Products Market Dynamics
One of the major reasons for the global anti-stretch mark products market growth is the increasing number of pregnant women. Pregnant women are most susceptible to getting stretch marks. Moreover, it has been observed that pregnant women grow an inclination to eliminate these marks and scars early after the birth of the baby. Moreover, women are eager to buy the best products for themselves so as to get cleared of these marks as early as possible. Seeing this tendency, key players are introducing many new products which precisely cater to pregnant women and are expected to propel the growth of the market in the forecast period.
Key Features of the Reports
- The report provides granular level information about the market size, regional market share, historic market (2018-2022), and forecast (2023-2029)
- The report covers in-detail insights about the competitor’s overview, company share analysis, key market developments, and their key strategies
- The report outlines drivers, restraints, unmet needs, and trends that are currently affecting the market
- The report tracks recent innovations, key developments, and start-up details that are actively working in the market
- The report provides a plethora of information about market entry strategies, regulatory framework, and reimbursement scenario

Anti Stretch Mark Products Market Segmentation
By Product Type
By Nature
- Organic
- Conventional
By Distribution Channel
- Hypermarket & Supermarket
- Pharmacy & Drug Stores
- Specialty Store
- Online
- Others
By End Users
- Pediatric
- Adult
By Geography
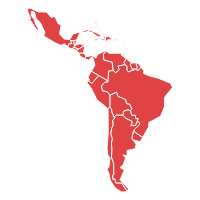
- Latin America
- North America
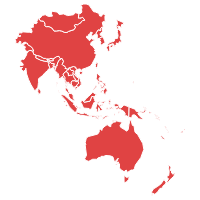
- Asia Pacific
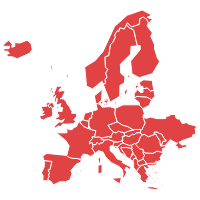
- Europe
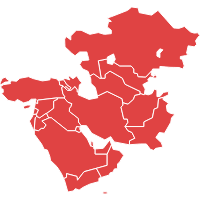
- Middle East and Africa
Frequently Asked Questions
The Anti-stretch mark products market size was valued at USD 1,534.6 million in 2022.
The Anti-stretch mark products market has been classified into North America, Asia Pacific, Europe, Latin America, Middle East and Africa, and the rest of MEA.
The Anti-stretch mark products market key players are L’Oréal S.A, Beiersdorf AG, Mustela, The Clorox Company (Burt’s Bees), Bio Oil, Clarins, Earth Mama Organics, The Estée Lauder Companies Inc, Himalaya Global Holdings Ltd, Crown Laboratories Inc (StriVectin)
| 1.Executive Summary |
| 2.Global Anti-Stretch Mark Products Market Introduction |
| 2.1.Global Anti-Stretch Mark Products Market - Taxonomy |
| 2.2.Global Anti-Stretch Mark Products Market - Definitions |
| 2.2.1.Product Type |
| 2.2.2.Nature |
| 2.2.3.Distribution Channel |
| 2.2.4.End Users |
| 2.2.5.Region |
| 3.Global Anti-Stretch Mark Products Market Dynamics |
| 3.1. Drivers |
| 3.2. Restraints |
| 3.3. Opportunities/Unmet Needs of the Market |
| 3.4. Trends |
| 3.5. Product Landscape |
| 3.6. New Product Launches |
| 3.7. Impact of COVID 19 on Market |
| 4.Global Anti-Stretch Mark Products Market Analysis, 2018 - 2022 and Forecast 2023 - 2029 |
| 4.1. Market Analysis, 2018 - 2022 and Forecast, 2023 - 2029, (Sales Value USD Million) |
| 4.2. Year-Over-Year (Y-o-Y) Growth Analysis (%) |
| 4.3. Market Opportunity Analysis |
| 5.Global Anti-Stretch Mark Products Market By Product Type, 2018 - 2022 and Forecast 2023 - 2029 (Sales Value USD Million) |
| 5.1. Creams |
| 5.1.1. Market Analysis, 2018 - 2022 and Forecast, 2023 - 2029, (Sales Value USD Million) |
| 5.1.2. Year-Over-Year (Y-o-Y) Growth Analysis (%) and Market Share Analysis (%) |
| 5.1.3. Market Opportunity Analysis |
| 5.2. Body Butter |
| 5.2.1. Market Analysis, 2018 - 2022 and Forecast, 2023 - 2029, (Sales Value USD Million) |
| 5.2.2. Year-Over-Year (Y-o-Y) Growth Analysis (%) and Market Share Analysis (%) |
| 5.2.3. Market Opportunity Analysis |
| 5.3. Lotions |
| 5.3.1. Market Analysis, 2018 - 2022 and Forecast, 2023 - 2029, (Sales Value USD Million) |
| 5.3.2. Year-Over-Year (Y-o-Y) Growth Analysis (%) and Market Share Analysis (%) |
| 5.3.3. Market Opportunity Analysis |
| 5.4. Serum |
| 5.4.1. Market Analysis, 2018 - 2022 and Forecast, 2023 - 2029, (Sales Value USD Million) |
| 5.4.2. Year-Over-Year (Y-o-Y) Growth Analysis (%) and Market Share Analysis (%) |
| 5.4.3. Market Opportunity Analysis |
| 5.5. Massage Oil |
| 5.5.1. Market Analysis, 2018 - 2022 and Forecast, 2023 - 2029, (Sales Value USD Million) |
| 5.5.2. Year-Over-Year (Y-o-Y) Growth Analysis (%) and Market Share Analysis (%) |
| 5.5.3. Market Opportunity Analysis |
| 5.6. Others |
| 5.6.1. Market Analysis, 2018 - 2022 and Forecast, 2023 - 2029, (Sales Value USD Million) |
| 5.6.2. Year-Over-Year (Y-o-Y) Growth Analysis (%) and Market Share Analysis (%) |
| 5.6.3. Market Opportunity Analysis |
| 6.Global Anti-Stretch Mark Products Market By Nature, 2018 - 2022 and Forecast 2023 - 2029 (Sales Value USD Million) |
| 6.1. Organic |
| 6.1.1. Market Analysis, 2018 - 2022 and Forecast, 2023 - 2029, (Sales Value USD Million) |
| 6.1.2. Year-Over-Year (Y-o-Y) Growth Analysis (%) and Market Share Analysis (%) |
| 6.1.3. Market Opportunity Analysis |
| 6.2. Conventional |
| 6.2.1. Market Analysis, 2018 - 2022 and Forecast, 2023 - 2029, (Sales Value USD Million) |
| 6.2.2. Year-Over-Year (Y-o-Y) Growth Analysis (%) and Market Share Analysis (%) |
| 6.2.3. Market Opportunity Analysis |
| 7.Global Anti-Stretch Mark Products Market By Distribution Channel, 2018 - 2022 and Forecast 2023 - 2029 (Sales Value USD Million) |
| 7.1. Hypermarket & Supermarket |
| 7.1.1. Market Analysis, 2018 - 2022 and Forecast, 2023 - 2029, (Sales Value USD Million) |
| 7.1.2. Year-Over-Year (Y-o-Y) Growth Analysis (%) and Market Share Analysis (%) |
| 7.1.3. Market Opportunity Analysis |
| 7.2. Pharmacy & Drug Stores |
| 7.2.1. Market Analysis, 2018 - 2022 and Forecast, 2023 - 2029, (Sales Value USD Million) |
| 7.2.2. Year-Over-Year (Y-o-Y) Growth Analysis (%) and Market Share Analysis (%) |
| 7.2.3. Market Opportunity Analysis |
| 7.3. Specialty Store |
| 7.3.1. Market Analysis, 2018 - 2022 and Forecast, 2023 - 2029, (Sales Value USD Million) |
| 7.3.2. Year-Over-Year (Y-o-Y) Growth Analysis (%) and Market Share Analysis (%) |
| 7.3.3. Market Opportunity Analysis |
| 7.4. Online |
| 7.4.1. Market Analysis, 2018 - 2022 and Forecast, 2023 - 2029, (Sales Value USD Million) |
| 7.4.2. Year-Over-Year (Y-o-Y) Growth Analysis (%) and Market Share Analysis (%) |
| 7.4.3. Market Opportunity Analysis |
| 7.5. Others |
| 7.5.1. Market Analysis, 2018 - 2022 and Forecast, 2023 - 2029, (Sales Value USD Million) |
| 7.5.2. Year-Over-Year (Y-o-Y) Growth Analysis (%) and Market Share Analysis (%) |
| 7.5.3. Market Opportunity Analysis |
| 8.Global Anti-Stretch Mark Products Market By End Users, 2018 - 2022 and Forecast 2023 - 2029 (Sales Value USD Million) |
| 8.1. Pediatric |
| 8.1.1. Market Analysis, 2018 - 2022 and Forecast, 2023 - 2029, (Sales Value USD Million) |
| 8.1.2. Year-Over-Year (Y-o-Y) Growth Analysis (%) and Market Share Analysis (%) |
| 8.1.3. Market Opportunity Analysis |
| 8.2. Adult |
| 8.2.1. Market Analysis, 2018 - 2022 and Forecast, 2023 - 2029, (Sales Value USD Million) |
| 8.2.2. Year-Over-Year (Y-o-Y) Growth Analysis (%) and Market Share Analysis (%) |
| 8.2.3. Market Opportunity Analysis |
| 9.Global Anti-Stretch Mark Products Market By Region, 2018 - 2022 and Forecast 2023 - 2029 (Sales Value USD Million) |
| 9.1. North America |
| 9.1.1. Market Analysis, 2018 - 2022 and Forecast, 2023 - 2029, (Sales Value USD Million) |
| 9.1.2. Year-Over-Year (Y-o-Y) Growth Analysis (%) and Market Share Analysis (%) |
| 9.1.3. Market Opportunity Analysis |
| 9.2. Europe |
| 9.2.1. Market Analysis, 2018 - 2022 and Forecast, 2023 - 2029, (Sales Value USD Million) |
| 9.2.2. Year-Over-Year (Y-o-Y) Growth Analysis (%) and Market Share Analysis (%) |
| 9.2.3. Market Opportunity Analysis |
| 9.3. Asia Pacific (APAC) |
| 9.3.1. Market Analysis, 2018 - 2022 and Forecast, 2023 - 2029, (Sales Value USD Million) |
| 9.3.2. Year-Over-Year (Y-o-Y) Growth Analysis (%) and Market Share Analysis (%) |
| 9.3.3. Market Opportunity Analysis |
| 9.4. Middle East and Africa (MEA) |
| 9.4.1. Market Analysis, 2018 - 2022 and Forecast, 2023 - 2029, (Sales Value USD Million) |
| 9.4.2. Year-Over-Year (Y-o-Y) Growth Analysis (%) and Market Share Analysis (%) |
| 9.4.3. Market Opportunity Analysis |
| 9.5. Latin America |
| 9.5.1. Market Analysis, 2018 - 2022 and Forecast, 2023 - 2029, (Sales Value USD Million) |
| 9.5.2. Year-Over-Year (Y-o-Y) Growth Analysis (%) and Market Share Analysis (%) |
| 9.5.3. Market Opportunity Analysis |
| 10.North America Anti-Stretch Mark Products Market ,2018 - 2022 and Forecast 2023 - 2029 (Sales Value USD Million) |
| 10.1. Product Type Analysis 2018 - 2022 and Forecast 2023 - 2029 by Sales Value USD Million, Y-o-Y Growth (%), and Market Share (%) |
| 10.1.1.Creams |
| 10.1.2.Body Butter |
| 10.1.3.Lotions |
| 10.1.4.Serum |
| 10.1.5.Massage Oil |
| 10.1.6.Others |
| 10.2. Nature Analysis 2018 - 2022 and Forecast 2023 - 2029 by Sales Value USD Million, Y-o-Y Growth (%), and Market Share (%) |
| 10.2.1.Organic |
| 10.2.2.Conventional |
| 10.3. Distribution Channel Analysis 2018 - 2022 and Forecast 2023 - 2029 by Sales Value USD Million, Y-o-Y Growth (%), and Market Share (%) |
| 10.3.1.Hypermarket & Supermarket |
| 10.3.2.Pharmacy & Drug Stores |
| 10.3.3.Specialty Store |
| 10.3.4.Online |
| 10.3.5.Others |
| 10.4. End Users Analysis 2018 - 2022 and Forecast 2023 - 2029 by Sales Value USD Million, Y-o-Y Growth (%), and Market Share (%) |
| 10.4.1.Pediatric |
| 10.4.2.Adult |
| 10.5. Country Analysis 2018 - 2022 and Forecast 2023 - 2029 by Sales Value USD Million, Y-o-Y Growth (%), and Market Share (%) |
| 10.5.1.United States of America (USA) |
| 10.5.2.Canada |
| 11.Europe Anti-Stretch Mark Products Market ,2018 - 2022 and Forecast 2023 - 2029 (Sales Value USD Million) |
| 11.1. Product Type Analysis and Forecast by Sales Value USD Million, Y-o-Y Growth (%), and Market Share (%) |
| 11.1.1.Creams |
| 11.1.2.Body Butter |
| 11.1.3.Lotions |
| 11.1.4.Serum |
| 11.1.5.Massage Oil |
| 11.1.6.Others |
| 11.2. Nature Analysis 2018 - 2022 and Forecast 2023 - 2029 by Sales Value USD Million, Y-o-Y Growth (%), and Market Share (%) |
| 11.2.1.Organic |
| 11.2.2.Conventional |
| 11.3. Distribution Channel Analysis 2018 - 2022 and Forecast 2023 - 2029 by Sales Value USD Million, Y-o-Y Growth (%), and Market Share (%) |
| 11.3.1.Hypermarket & Supermarket |
| 11.3.2.Pharmacy & Drug Stores |
| 11.3.3.Specialty Store |
| 11.3.4.Online |
| 11.3.5.Others |
| 11.4. End Users Analysis 2018 - 2022 and Forecast 2023 - 2029 by Sales Value USD Million, Y-o-Y Growth (%), and Market Share (%) |
| 11.4.1.Pediatric |
| 11.4.2.Adult |
| 11.5. Country Analysis 2018 - 2022 and Forecast 2023 - 2029 by Sales Value USD Million, Y-o-Y Growth (%), and Market Share (%) |
| 11.5.1.Germany |
| 11.5.2.France |
| 11.5.3.Italy |
| 11.5.4.United Kingdom (UK) |
| 11.5.5.Spain |
| 11.5.6.Rest of EU |
| 12.Asia Pacific (APAC) Anti-Stretch Mark Products Market ,2018 - 2022 and Forecast 2023 - 2029 (Sales Value USD Million) |
| 12.1. Product Type Analysis and Forecast by Sales Value USD Million, Y-o-Y Growth (%), and Market Share (%) |
| 12.1.1.Creams |
| 12.1.2.Body Butter |
| 12.1.3.Lotions |
| 12.1.4.Serum |
| 12.1.5.Massage Oil |
| 12.1.6.Others |
| 12.2. Nature Analysis 2018 - 2022 and Forecast 2023 - 2029 by Sales Value USD Million, Y-o-Y Growth (%), and Market Share (%) |
| 12.2.1.Organic |
| 12.2.2.Conventional |
| 12.3. Distribution Channel Analysis 2018 - 2022 and Forecast 2023 - 2029 by Sales Value USD Million, Y-o-Y Growth (%), and Market Share (%) |
| 12.3.1.Hypermarket & Supermarket |
| 12.3.2.Pharmacy & Drug Stores |
| 12.3.3.Specialty Store |
| 12.3.4.Online |
| 12.3.5.Others |
| 12.4. End Users Analysis 2018 - 2022 and Forecast 2023 - 2029 by Sales Value USD Million, Y-o-Y Growth (%), and Market Share (%) |
| 12.4.1.Pediatric |
| 12.4.2.Adult |
| 12.5. Country Analysis 2018 - 2022 and Forecast 2023 - 2029 by Sales Value USD Million, Y-o-Y Growth (%), and Market Share (%) |
| 12.5.1.China |
| 12.5.2.India |
| 12.5.3.Australia and New Zealand (ANZ) |
| 12.5.4.Japan |
| 12.5.5.Rest of APAC |
| 13.Middle East and Africa (MEA) Anti-Stretch Mark Products Market ,2018 - 2022 and Forecast 2023 - 2029 (Sales Value USD Million) |
| 13.1. Product Type Analysis and Forecast by Sales Value USD Million, Y-o-Y Growth (%), and Market Share (%) |
| 13.1.1.Creams |
| 13.1.2.Body Butter |
| 13.1.3.Lotions |
| 13.1.4.Serum |
| 13.1.5.Massage Oil |
| 13.1.6.Others |
| 13.2. Nature Analysis 2018 - 2022 and Forecast 2023 - 2029 by Sales Value USD Million, Y-o-Y Growth (%), and Market Share (%) |
| 13.2.1.Organic |
| 13.2.2.Conventional |
| 13.3. Distribution Channel Analysis 2018 - 2022 and Forecast 2023 - 2029 by Sales Value USD Million, Y-o-Y Growth (%), and Market Share (%) |
| 13.3.1.Hypermarket & Supermarket |
| 13.3.2.Pharmacy & Drug Stores |
| 13.3.3.Specialty Store |
| 13.3.4.Online |
| 13.3.5.Others |
| 13.4. End Users Analysis 2018 - 2022 and Forecast 2023 - 2029 by Sales Value USD Million, Y-o-Y Growth (%), and Market Share (%) |
| 13.4.1.Pediatric |
| 13.4.2.Adult |
| 13.5. Country Analysis 2018 - 2022 and Forecast 2023 - 2029 by Sales Value USD Million, Y-o-Y Growth (%), and Market Share (%) |
| 13.5.1.GCC Countries |
| 13.5.2.South Africa |
| 13.5.3.Rest of MEA |
| 14.Latin America Anti-Stretch Mark Products Market ,2018 - 2022 and Forecast 2023 - 2029 (Sales Value USD Million) |
| 14.1. Product Type Analysis and Forecast by Sales Value USD Million, Y-o-Y Growth (%), and Market Share (%) |
| 14.1.1.Creams |
| 14.1.2.Body Butter |
| 14.1.3.Lotions |
| 14.1.4.Serum |
| 14.1.5.Massage Oil |
| 14.1.6.Others |
| 14.2. Nature Analysis 2018 - 2022 and Forecast 2023 - 2029 by Sales Value USD Million, Y-o-Y Growth (%), and Market Share (%) |
| 14.2.1.Organic |
| 14.2.2.Conventional |
| 14.3. Distribution Channel Analysis 2018 - 2022 and Forecast 2023 - 2029 by Sales Value USD Million, Y-o-Y Growth (%), and Market Share (%) |
| 14.3.1.Hypermarket & Supermarket |
| 14.3.2.Pharmacy & Drug Stores |
| 14.3.3.Specialty Store |
| 14.3.4.Online |
| 14.3.5.Others |
| 14.4. End Users Analysis 2018 - 2022 and Forecast 2023 - 2029 by Sales Value USD Million, Y-o-Y Growth (%), and Market Share (%) |
| 14.4.1.Pediatric |
| 14.4.2.Adult |
| 14.5. Country Analysis 2018 - 2022 and Forecast 2023 - 2029 by Sales Value USD Million, Y-o-Y Growth (%), and Market Share (%) |
| 14.5.1.Brazil |
| 14.5.2.Mexico |
| 14.5.3.Rest of LA |
| 15. Competition Landscape |
| 15.1. Market Player Profiles (Introduction, Brand/Product Sales, Financial Analysis, Product Offerings, Key Developments, Collaborations, M & A, Strategies, and SWOT Analysis) |
| 15.2.1.L’Oréal S.A |
| 15.2.2.Beiersdorf AG |
| 15.2.3.Mustela |
| 15.2.4.The Clorox Company (Burt’s Bees) |
| 15.2.5.Bio Oil |
| 15.2.6.Clarins |
| 15.2.7.Earth Mama Organics |
| 15.2.8.The Estée Lauder Companies Inc. |
| 15.2.9.Himalaya Global Holdings Ltd |
| 15.2.10.Crown Laboratories Inc (StriVectin) |
| 16. Research Methodology |
| 17. Appendix and Abbreviations |
- L’Oréal S.A
- Beiersdorf AG
- Mustela
- The Clorox Company (Burt’s Bees)
- Bio Oil
- Clarins
- Earth Mama Organics
- The Estée Lauder Companies Inc.
- Himalaya Global Holdings Ltd
- Crown Laboratories Inc (StriVectin)
