- Tocolytic Drugs
- Beta Mimetic
- Calcium Channel Blockers
- NSAIDS
- Corticosteroids
- Magnesium Sulphate
- Antibiotics
- Others
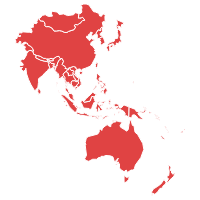
Asia Pacific Preterm Labor Treatment Market size was valued at USD x billion in 2022 and is expected to reach USD x billion by 2029 growing at a CAGR of x% during the forecast period 2023 to 2029. Increase in technological advancements, increasing demand for preterm therapeutics and diagnostics, increase in support of government, increase in R&D investments by market players are expected to propel the growth of preterm labor treatment market. However, lack of awareness, stringent regulatory framework, high costs associated with the treatment will hamper the growth of preterm labor treatment market.
Asia Pacific Preterm Labor Treatment Market Dynamics
Increase in premature birth cases and rapid increase birthrate are major driving factors of preterm labor treatment market. As per WHO statistics, every year 15Mn babies are born.
Key Features of the Reports
- The asia pacific preterm labor treatment market report provides granular level information about the market size, regional market share, historic market (2018 to 2022) and forecast (2023 to 2029)
- The report covers in-detail insights about the competitor’s overview, company share analysis, key market developments, and their key strategies
- The report outlines drivers, restraints, unmet needs, and trends that are currently affecting the market
- The report tracks recent innovations, key developments and startup’s details that are actively working in the market
- The report provides plethora of information about market entry strategies, regulatory framework and reimbursement scenario
- The report analyses the impact of socio-political environment through PESTLE Analysis and competition through Porter’s Five Force Analysis in addition to recent technology advancements and innovations in the market

Asia Pacific Preterm Labor Treatment Market Segmentation
By Drugs Type
By Dosage form
- Tablets
- Capsules
- Injection
By End User
- Hospitals
- Pediatric and Neonatal Clinics
- Nursing Homes
- Pharmacy
Frequently Asked Questions
2023 is the base year and 2029 is the forecast year.
The report covers the asia pacific labor treatment market data: China, India, Japan, Australia & New Zealand
The asia pacific preterm labor treatment market key players are Pfizer, Novartis, Merck & Co, Sanofi, Johnson and Johnson, GlaxoSmithKline, AstraZeneca, Cipla
| 1.Executive Summary |
| 2. Asia Pacific Preterm Labor Treatment Market Introduction |
| 2.1. Asia Pacific Preterm Labor Treatment Market - Taxonomy |
| 2.2. Asia Pacific Preterm Labor Treatment Market - Definitions |
| 2.2.1.Drugs Type |
| 2.2.2.Dosage form |
| 2.2.3.End User |
| 2.2.4.Country |
| 3. Asia Pacific Preterm Labor Treatment Market Dynamics |
| 3.1. Drivers |
| 3.2. Restraints |
| 3.3. Opportunities/Unmet Needs of the Market |
| 3.4. Trends |
| 3.5. Product Landscape |
| 3.6. New Product Launches |
| 3.7. Impact of COVID 19 on Market |
| 4. Asia Pacific Preterm Labor Treatment Market Analysis, 2018-2022 and Forecast 2023-2029 |
| 4.1. Market Analysis, 2018-2022 and Forecast, 2023-2029, (Sales Value USD Million) |
| 4.2. Year-Over-Year (Y-o-Y) Growth Analysis (%) |
| 4.3. Market Opportunity Analysis |
| 5. Asia Pacific Preterm Labor Treatment Market By Drugs Type, 2018-2022 and Forecast 2023-2029 (Sales Value USD Million) |
| 5.1. Tocolytic Drugs |
| 5.1.1. Market Analysis, 2018-2022 and Forecast, 2023-2029, (Sales Value USD Million) |
| 5.1.2. Year-Over-Year (Y-o-Y) Growth Analysis (%) and Market Share Analysis (%) |
| 5.1.3. Market Opportunity Analysis |
| 5.2. Beta Mimetic |
| 5.2.1. Market Analysis, 2018-2022 and Forecast, 2023-2029, (Sales Value USD Million) |
| 5.2.2. Year-Over-Year (Y-o-Y) Growth Analysis (%) and Market Share Analysis (%) |
| 5.2.3. Market Opportunity Analysis |
| 5.3. Calcium Channel Blockers |
| 5.3.1. Market Analysis, 2018-2022 and Forecast, 2023-2029, (Sales Value USD Million) |
| 5.3.2. Year-Over-Year (Y-o-Y) Growth Analysis (%) and Market Share Analysis (%) |
| 5.3.3. Market Opportunity Analysis |
| 5.4. NSAIDS |
| 5.4.1. Market Analysis, 2018-2022 and Forecast, 2023-2029, (Sales Value USD Million) |
| 5.4.2. Year-Over-Year (Y-o-Y) Growth Analysis (%) and Market Share Analysis (%) |
| 5.4.3. Market Opportunity Analysis |
| 5.5. Corticosteroids |
| 5.5.1. Market Analysis, 2018-2022 and Forecast, 2023-2029, (Sales Value USD Million) |
| 5.5.2. Year-Over-Year (Y-o-Y) Growth Analysis (%) and Market Share Analysis (%) |
| 5.5.3. Market Opportunity Analysis |
| 5.6. Magnesium Sulphate |
| 5.6.1. Market Analysis, 2018-2022 and Forecast, 2023-2029, (Sales Value USD Million) |
| 5.6.2. Year-Over-Year (Y-o-Y) Growth Analysis (%) and Market Share Analysis (%) |
| 5.6.3. Market Opportunity Analysis |
| 5.7. Antibiotics |
| 5.7.1. Market Analysis, 2018-2022 and Forecast, 2023-2029, (Sales Value USD Million) |
| 5.7.2. Year-Over-Year (Y-o-Y) Growth Analysis (%) and Market Share Analysis (%) |
| 5.7.3. Market Opportunity Analysis |
| 5.8. Others |
| 5.8.1. Market Analysis, 2018-2022 and Forecast, 2023-2029, (Sales Value USD Million) |
| 5.8.2. Year-Over-Year (Y-o-Y) Growth Analysis (%) and Market Share Analysis (%) |
| 5.8.3. Market Opportunity Analysis |
| 6. Asia Pacific Preterm Labor Treatment Market By Dosage form, 2018-2022 and Forecast 2023-2029 (Sales Value USD Million) |
| 6.1. Tablets |
| 6.1.1. Market Analysis, 2018-2022 and Forecast, 2023-2029, (Sales Value USD Million) |
| 6.1.2. Year-Over-Year (Y-o-Y) Growth Analysis (%) and Market Share Analysis (%) |
| 6.1.3. Market Opportunity Analysis |
| 6.2. Capsules |
| 6.2.1. Market Analysis, 2018-2022 and Forecast, 2023-2029, (Sales Value USD Million) |
| 6.2.2. Year-Over-Year (Y-o-Y) Growth Analysis (%) and Market Share Analysis (%) |
| 6.2.3. Market Opportunity Analysis |
| 6.3. Injection |
| 6.3.1. Market Analysis, 2018-2022 and Forecast, 2023-2029, (Sales Value USD Million) |
| 6.3.2. Year-Over-Year (Y-o-Y) Growth Analysis (%) and Market Share Analysis (%) |
| 6.3.3. Market Opportunity Analysis |
| 7. Asia Pacific Preterm Labor Treatment Market By End User, 2018-2022 and Forecast 2023-2029 (Sales Value USD Million) |
| 7.1. Hospitals |
| 7.1.1. Market Analysis, 2018-2022 and Forecast, 2023-2029, (Sales Value USD Million) |
| 7.1.2. Year-Over-Year (Y-o-Y) Growth Analysis (%) and Market Share Analysis (%) |
| 7.1.3. Market Opportunity Analysis |
| 7.2. Pediatric and Neonatal Clinics |
| 7.2.1. Market Analysis, 2018-2022 and Forecast, 2023-2029, (Sales Value USD Million) |
| 7.2.2. Year-Over-Year (Y-o-Y) Growth Analysis (%) and Market Share Analysis (%) |
| 7.2.3. Market Opportunity Analysis |
| 7.3. Nursing Homes |
| 7.3.1. Market Analysis, 2018-2022 and Forecast, 2023-2029, (Sales Value USD Million) |
| 7.3.2. Year-Over-Year (Y-o-Y) Growth Analysis (%) and Market Share Analysis (%) |
| 7.3.3. Market Opportunity Analysis |
| 7.4. Pharmacy |
| 7.4.1. Market Analysis, 2018-2022 and Forecast, 2023-2029, (Sales Value USD Million) |
| 7.4.2. Year-Over-Year (Y-o-Y) Growth Analysis (%) and Market Share Analysis (%) |
| 7.4.3. Market Opportunity Analysis |
| 8. Asia Pacific Preterm Labor Treatment Market By Country, 2018-2022 and Forecast 2023-2029 (Sales Value USD Million) |
| 8.1. China |
| 8.1.1. Market Analysis, 2018-2022 and Forecast, 2023-2029, (Sales Value USD Million) |
| 8.1.2. Year-Over-Year (Y-o-Y) Growth Analysis (%) and Market Share Analysis (%) |
| 8.1.3. Market Opportunity Analysis |
| 8.2. India |
| 8.2.1. Market Analysis, 2018-2022 and Forecast, 2023-2029, (Sales Value USD Million) |
| 8.2.2. Year-Over-Year (Y-o-Y) Growth Analysis (%) and Market Share Analysis (%) |
| 8.2.3. Market Opportunity Analysis |
| 8.3. Australia and New Zealand (ANZ) |
| 8.3.1. Market Analysis, 2018-2022 and Forecast, 2023-2029, (Sales Value USD Million) |
| 8.3.2. Year-Over-Year (Y-o-Y) Growth Analysis (%) and Market Share Analysis (%) |
| 8.3.3. Market Opportunity Analysis |
| 8.4. Japan |
| 8.4.1. Market Analysis, 2018-2022 and Forecast, 2023-2029, (Sales Value USD Million) |
| 8.4.2. Year-Over-Year (Y-o-Y) Growth Analysis (%) and Market Share Analysis (%) |
| 8.4.3. Market Opportunity Analysis |
| 8.5. Rest of APAC |
| 8.5.1. Market Analysis, 2018-2022 and Forecast, 2023-2029, (Sales Value USD Million) |
| 8.5.2. Year-Over-Year (Y-o-Y) Growth Analysis (%) and Market Share Analysis (%) |
| 8.5.3. Market Opportunity Analysis |
| 9.China Preterm Labor Treatment Market ,2018-2022 and Forecast 2023-2029 (Sales Value USD Million) |
| 9.1. Drugs Type Analysis 2018-2022 and Forecast 2023-2029 by Sales Value USD Million, Y-o-Y Growth (%), and Market Share (%) |
| 9.1.1.Tocolytic Drugs |
| 9.1.2.Beta Mimetic |
| 9.1.3.Calcium Channel Blockers |
| 9.1.4.NSAIDS |
| 9.1.5.Corticosteroids |
| 9.1.6.Magnesium Sulphate |
| 9.1.7.Antibiotics |
| 9.1.8.Others |
| 9.2. Dosage form Analysis 2018-2022 and Forecast 2023-2029 by Sales Value USD Million, Y-o-Y Growth (%), and Market Share (%) |
| 9.2.1.Tablets |
| 9.2.2.Capsules |
| 9.2.3.Injection |
| 9.3. End User Analysis 2018-2022 and Forecast 2023-2029 by Sales Value USD Million, Y-o-Y Growth (%), and Market Share (%) |
| 9.3.1.Hospitals |
| 9.3.2.Pediatric and Neonatal Clinics |
| 9.3.3.Nursing Homes |
| 9.3.4.Pharmacy |
| 10.India Preterm Labor Treatment Market ,2018-2022 and Forecast 2023-2029 (Sales Value USD Million) |
| 10.1. Drugs Type Analysis and Forecast by Sales Value USD Million, Y-o-Y Growth (%), and Market Share (%) |
| 10.1.1.Tocolytic Drugs |
| 10.1.2.Beta Mimetic |
| 10.1.3.Calcium Channel Blockers |
| 10.1.4.NSAIDS |
| 10.1.5.Corticosteroids |
| 10.1.6.Magnesium Sulphate |
| 10.1.7.Antibiotics |
| 10.1.8.Others |
| 10.2. Dosage form Analysis 2018-2022 and Forecast 2023-2029 by Sales Value USD Million, Y-o-Y Growth (%), and Market Share (%) |
| 10.2.1.Tablets |
| 10.2.2.Capsules |
| 10.2.3.Injection |
| 10.3. End User Analysis 2018-2022 and Forecast 2023-2029 by Sales Value USD Million, Y-o-Y Growth (%), and Market Share (%) |
| 10.3.1.Hospitals |
| 10.3.2.Pediatric and Neonatal Clinics |
| 10.3.3.Nursing Homes |
| 10.3.4.Pharmacy |
| 11.Australia and New Zealand (ANZ) Preterm Labor Treatment Market ,2018-2022 and Forecast 2023-2029 (Sales Value USD Million) |
| 11.1. Drugs Type Analysis and Forecast by Sales Value USD Million, Y-o-Y Growth (%), and Market Share (%) |
| 11.1.1.Tocolytic Drugs |
| 11.1.2.Beta Mimetic |
| 11.1.3.Calcium Channel Blockers |
| 11.1.4.NSAIDS |
| 11.1.5.Corticosteroids |
| 11.1.6.Magnesium Sulphate |
| 11.1.7.Antibiotics |
| 11.1.8.Others |
| 11.2. Dosage form Analysis 2018-2022 and Forecast 2023-2029 by Sales Value USD Million, Y-o-Y Growth (%), and Market Share (%) |
| 11.2.1.Tablets |
| 11.2.2.Capsules |
| 11.2.3.Injection |
| 11.3. End User Analysis 2018-2022 and Forecast 2023-2029 by Sales Value USD Million, Y-o-Y Growth (%), and Market Share (%) |
| 11.3.1.Hospitals |
| 11.3.2.Pediatric and Neonatal Clinics |
| 11.3.3.Nursing Homes |
| 11.3.4.Pharmacy |
| 12.Japan Preterm Labor Treatment Market ,2018-2022 and Forecast 2023-2029 (Sales Value USD Million) |
| 12.1. Drugs Type Analysis and Forecast by Sales Value USD Million, Y-o-Y Growth (%), and Market Share (%) |
| 12.1.1.Tocolytic Drugs |
| 12.1.2.Beta Mimetic |
| 12.1.3.Calcium Channel Blockers |
| 12.1.4.NSAIDS |
| 12.1.5.Corticosteroids |
| 12.1.6.Magnesium Sulphate |
| 12.1.7.Antibiotics |
| 12.1.8.Others |
| 12.2. Dosage form Analysis 2018-2022 and Forecast 2023-2029 by Sales Value USD Million, Y-o-Y Growth (%), and Market Share (%) |
| 12.2.1.Tablets |
| 12.2.2.Capsules |
| 12.2.3.Injection |
| 12.3. End User Analysis 2018-2022 and Forecast 2023-2029 by Sales Value USD Million, Y-o-Y Growth (%), and Market Share (%) |
| 12.3.1.Hospitals |
| 12.3.2.Pediatric and Neonatal Clinics |
| 12.3.3.Nursing Homes |
| 12.3.4.Pharmacy |
| 13.Rest of APAC Preterm Labor Treatment Market ,2018-2022 and Forecast 2023-2029 (Sales Value USD Million) |
| 13.1. Drugs Type Analysis and Forecast by Sales Value USD Million, Y-o-Y Growth (%), and Market Share (%) |
| 13.1.1.Tocolytic Drugs |
| 13.1.2.Beta Mimetic |
| 13.1.3.Calcium Channel Blockers |
| 13.1.4.NSAIDS |
| 13.1.5.Corticosteroids |
| 13.1.6.Magnesium Sulphate |
| 13.1.7.Antibiotics |
| 13.1.8.Others |
| 13.2. Dosage form Analysis 2018-2022 and Forecast 2023-2029 by Sales Value USD Million, Y-o-Y Growth (%), and Market Share (%) |
| 13.2.1.Tablets |
| 13.2.2.Capsules |
| 13.2.3.Injection |
| 13.3. End User Analysis 2018-2022 and Forecast 2023-2029 by Sales Value USD Million, Y-o-Y Growth (%), and Market Share (%) |
| 13.3.1.Hospitals |
| 13.3.2.Pediatric and Neonatal Clinics |
| 13.3.3.Nursing Homes |
| 13.3.4.Pharmacy |
| 14. Competition Landscape |
| 14.1. Market Player Profiles (Introduction, Brand/Product Sales, Financial Analysis, Product Offerings, Key Developments, Collaborations, M & A, Strategies, and SWOT Analysis) |
| 14.2.1.Pfizer |
| 14.2.2.Novartis |
| 14.2.3.Merck & Co |
| 14.2.4.Sanofi |
| 14.2.5.Johnson and Johnson |
| 14.2.6.GlaxoSmithKline |
| 14.2.7.AstraZeneca |
| 14.2.8.Cipla |
| 15. Research Methodology |
| 16. Appendix and Abbreviations |
- Pfizer
- Novartis
- Merck & Co
- Sanofi
- Johnson and Johnson
- GlaxoSmithKline
- AstraZeneca
- Cipla
