- Fruits and Vegetable
- Cereals and Grains
- Pulses and Oilseeds
- Turf and Ornamental
- Flowers and Others
North America Center Pivot Irrigation Systems Market is expected to grow at a CAGR of x% during the forecast period 2023 to 2029. North America Center Pivot Irrigation Systems Market is known as central pivot irrigation or circle irrigation or waterwheel irrigation. North America Center Pivot Irrigation Systems method is crop irrigation method in which equipment is rotated around the pivot by watering the crops with the help of sprinklers. Earlier, most of the center pivot systems are water powered while currently most of them are propelled by electric motors. Center pivot irrigation system was invented by Farmer Frank Zybach from Colorado in 1940. Center pivot irrigation system was recognised as most preferable method of enhancing distribution of water to the whole crop in the fields. This report presents market dynamics elaborately to identify the current market trends & drivers, future opportunities and possible challenges to the key stakeholders operating in the market. In addition, market report includes the competition analysis with vividly illustrated the competition dashboard to assess the market competition. Moreover, PBI analyzed Market to better equip clients with possible investment opportunities across the regions (Country Investment Hot-Spots) and market unmet needs. Key stakeholders of the market report include raw material suppliers, manufacturers, marketers, policymakers, and healthcare service providers, who are engaged in usage and advocacy of advanced wound care products.
North America Center Pivot Irrigation Systems Market Dynamics
Increase in government subsidies and initiatives, Less wastage of water, Efficiency of the water management, Increase in demand for the high quality of crops and Large returns of investments in comparison with conventional irrigation systems are driving North America Center Pivot Irrigation Systems Market.
Key Features of the Reports
- The report provides granular level information about the market size, regional market share, historic market (2018 to 2022) and forecast (2023 to 2029)
- The report covers in-detail insights about the competitor’s overview, company share analysis, key market developments, and their key strategies
- The report outlines drivers, restraints, unmet needs, and trends that are currently affecting the market
- The report tracks recent innovations, key developments and startup’s details that are actively working in the market
- The report provides plethora of information about market entry strategies, regulatory framework and reimbursement scenario
- The report analyses the impact of socio-political environment through PESTLE Analysis and competition through Porter’s Five Force Analysis in addition to recent technology advancements and innovations in the market

North America Center Pivot Irrigation Systems Market Segmentation
By Crop Type
By Size of field
- Large
- Medium
- Small
By Components
- Pivot Points
- Control Panels
- Span
- Sprinkler Drop
- Drive Train
- Tower Drive Wheels
By Motion
- Mobile
- Immobile
Frequently Asked Questions
The key segments covered in the North America Center Pivot Irrigation Systems Market are: Crop Type, Size of the Field , Components, Motion
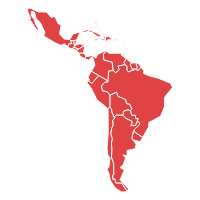
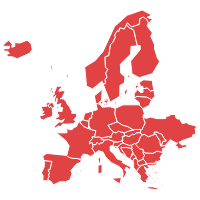
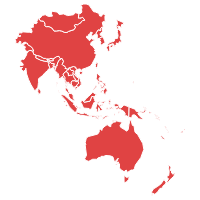
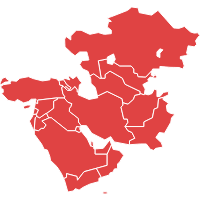
The report covers the five regions and 15+ countries market data: North America (United States, Canada), Europe (Germany, France, Italy, Spain, and United Kingdom (UK), Asia Pacific (China, India, Japan, Australia & New Zealand), Latin America (Brazil, Mexico, Argentina) and Middle East and Africa (Saudi Arabia, United Arab Emirates, South Africa).
In our report, we provide 12-15 market players’ information into the report. However, based on the client’s request we will provide additional country and regional market players information as well.
| 1.Executive Summary |
| 2.North America Center Pivot Irrigation Systems Market Introduction |
| 2.1.North America Center Pivot Irrigation Systems Market - Taxonomy |
| 2.2.North America Center Pivot Irrigation Systems Market - Definitions |
| 2.2.1. Crop Type |
| 2.2.2.Size of field |
| 2.2.3.Components |
| 2.2.4.Motion |
| 2.2.5.Region |
| 3.North America Center Pivot Irrigation Systems Market Dynamics |
| 3.1. Drivers |
| 3.2. Restraints |
| 3.3. Opportunities/Unmet Needs of the Market |
| 3.4. Trends |
| 3.5. Product Landscape |
| 3.6. New Product Launches |
| 3.7. Impact of COVID 19 on Market |
| 4.North America Center Pivot Irrigation Systems Market Analysis, 2018-2022 and Forecast 2023-2029 |
| 4.1. Market Analysis, 2018-2022 and Forecast, 2023-2029, (Sales Value USD Million) |
| 4.2. Year-Over-Year (Y-o-Y) Growth Analysis (%) |
| 4.3. Market Opportunity Analysis |
| 5.North America Center Pivot Irrigation Systems Market By Crop Type, 2018-2022 and Forecast 2023-2029 (Sales Value USD Million) |
| 5.1. Fruits and Vegetable |
| 5.1.1. Market Analysis, 2018-2022 and Forecast, 2023-2029, (Sales Value USD Million) |
| 5.1.2. Year-Over-Year (Y-o-Y) Growth Analysis (%) and Market Share Analysis (%) |
| 5.1.3. Market Opportunity Analysis |
| 5.2. Cereals and Grains |
| 5.2.1. Market Analysis, 2018-2022 and Forecast, 2023-2029, (Sales Value USD Million) |
| 5.2.2. Year-Over-Year (Y-o-Y) Growth Analysis (%) and Market Share Analysis (%) |
| 5.2.3. Market Opportunity Analysis |
| 5.3. Pulses and Oilseeds |
| 5.3.1. Market Analysis, 2018-2022 and Forecast, 2023-2029, (Sales Value USD Million) |
| 5.3.2. Year-Over-Year (Y-o-Y) Growth Analysis (%) and Market Share Analysis (%) |
| 5.3.3. Market Opportunity Analysis |
| 5.4. Turf and Ornamental |
| 5.4.1. Market Analysis, 2018-2022 and Forecast, 2023-2029, (Sales Value USD Million) |
| 5.4.2. Year-Over-Year (Y-o-Y) Growth Analysis (%) and Market Share Analysis (%) |
| 5.4.3. Market Opportunity Analysis |
| 5.5. Flowers and Others |
| 5.5.1. Market Analysis, 2018-2022 and Forecast, 2023-2029, (Sales Value USD Million) |
| 5.5.2. Year-Over-Year (Y-o-Y) Growth Analysis (%) and Market Share Analysis (%) |
| 5.5.3. Market Opportunity Analysis |
| 6.North America Center Pivot Irrigation Systems Market By Size of field, 2018-2022 and Forecast 2023-2029 (Sales Value USD Million) |
| 6.1. Large |
| 6.1.1. Market Analysis, 2018-2022 and Forecast, 2023-2029, (Sales Value USD Million) |
| 6.1.2. Year-Over-Year (Y-o-Y) Growth Analysis (%) and Market Share Analysis (%) |
| 6.1.3. Market Opportunity Analysis |
| 6.2. Medium |
| 6.2.1. Market Analysis, 2018-2022 and Forecast, 2023-2029, (Sales Value USD Million) |
| 6.2.2. Year-Over-Year (Y-o-Y) Growth Analysis (%) and Market Share Analysis (%) |
| 6.2.3. Market Opportunity Analysis |
| 6.3. Small |
| 6.3.1. Market Analysis, 2018-2022 and Forecast, 2023-2029, (Sales Value USD Million) |
| 6.3.2. Year-Over-Year (Y-o-Y) Growth Analysis (%) and Market Share Analysis (%) |
| 6.3.3. Market Opportunity Analysis |
| 7.North America Center Pivot Irrigation Systems Market By Components, 2018-2022 and Forecast 2023-2029 (Sales Value USD Million) |
| 7.1. Pivot Points |
| 7.1.1. Market Analysis, 2018-2022 and Forecast, 2023-2029, (Sales Value USD Million) |
| 7.1.2. Year-Over-Year (Y-o-Y) Growth Analysis (%) and Market Share Analysis (%) |
| 7.1.3. Market Opportunity Analysis |
| 7.2. Control Panels |
| 7.2.1. Market Analysis, 2018-2022 and Forecast, 2023-2029, (Sales Value USD Million) |
| 7.2.2. Year-Over-Year (Y-o-Y) Growth Analysis (%) and Market Share Analysis (%) |
| 7.2.3. Market Opportunity Analysis |
| 7.3. Span |
| 7.3.1. Market Analysis, 2018-2022 and Forecast, 2023-2029, (Sales Value USD Million) |
| 7.3.2. Year-Over-Year (Y-o-Y) Growth Analysis (%) and Market Share Analysis (%) |
| 7.3.3. Market Opportunity Analysis |
| 7.4. Sprinkler Drop |
| 7.4.1. Market Analysis, 2018-2022 and Forecast, 2023-2029, (Sales Value USD Million) |
| 7.4.2. Year-Over-Year (Y-o-Y) Growth Analysis (%) and Market Share Analysis (%) |
| 7.4.3. Market Opportunity Analysis |
| 7.5. Drive Train |
| 7.5.1. Market Analysis, 2018-2022 and Forecast, 2023-2029, (Sales Value USD Million) |
| 7.5.2. Year-Over-Year (Y-o-Y) Growth Analysis (%) and Market Share Analysis (%) |
| 7.5.3. Market Opportunity Analysis |
| 7.6. Tower Drive Wheels |
| 7.6.1. Market Analysis, 2018-2022 and Forecast, 2023-2029, (Sales Value USD Million) |
| 7.6.2. Year-Over-Year (Y-o-Y) Growth Analysis (%) and Market Share Analysis (%) |
| 7.6.3. Market Opportunity Analysis |
| 8.North America Center Pivot Irrigation Systems Market By Motion, 2018-2022 and Forecast 2023-2029 (Sales Value USD Million) |
| 8.1. Mobile |
| 8.1.1. Market Analysis, 2018-2022 and Forecast, 2023-2029, (Sales Value USD Million) |
| 8.1.2. Year-Over-Year (Y-o-Y) Growth Analysis (%) and Market Share Analysis (%) |
| 8.1.3. Market Opportunity Analysis |
| 8.2. Immobile |
| 8.2.1. Market Analysis, 2018-2022 and Forecast, 2023-2029, (Sales Value USD Million) |
| 8.2.2. Year-Over-Year (Y-o-Y) Growth Analysis (%) and Market Share Analysis (%) |
| 8.2.3. Market Opportunity Analysis |
| 9.North America Center Pivot Irrigation Systems Market By Region, 2018-2022 and Forecast 2023-2029 (Sales Value USD Million) |
| 9.1. North America |
| 9.1.1. Market Analysis, 2018-2022 and Forecast, 2023-2029, (Sales Value USD Million) |
| 9.1.2. Year-Over-Year (Y-o-Y) Growth Analysis (%) and Market Share Analysis (%) |
| 9.1.3. Market Opportunity Analysis |
| 10.North America Center Pivot Irrigation Systems Market ,2018-2022 and Forecast 2023-2029 (Sales Value USD Million) |
| 10.1. Crop Type Analysis 2018-2022 and Forecast 2023-2029 by Sales Value USD Million, Y-o-Y Growth (%), and Market Share (%) |
| 10.1.1.Fruits and Vegetable |
| 10.1.2.Cereals and Grains |
| 10.1.3.Pulses and Oilseeds |
| 10.1.4.Turf and Ornamental |
| 10.1.5.Flowers and Others |
| 10.2. Size of field Analysis 2018-2022 and Forecast 2023-2029 by Sales Value USD Million, Y-o-Y Growth (%), and Market Share (%) |
| 10.2.1.Large |
| 10.2.2.Medium |
| 10.2.3.Small |
| 10.3. Components Analysis 2018-2022 and Forecast 2023-2029 by Sales Value USD Million, Y-o-Y Growth (%), and Market Share (%) |
| 10.3.1.Pivot Points |
| 10.3.2.Control Panels |
| 10.3.3.Span |
| 10.3.4.Sprinkler Drop |
| 10.3.5.Drive Train |
| 10.3.6.Tower Drive Wheels |
| 10.4. Motion Analysis 2018-2022 and Forecast 2023-2029 by Sales Value USD Million, Y-o-Y Growth (%), and Market Share (%) |
| 10.4.1.Mobile |
| 10.4.2.Immobile |
| 10.5. Country Analysis 2018-2022 and Forecast 2023-2029 by Sales Value USD Million, Y-o-Y Growth (%), and Market Share (%) |
| 10.5.1.United States of America (USA) |
| 10.5.2.Canada |
| 11.2. Size of field Analysis 2018-2022 and Forecast 2023-2029 by Sales Value USD Million, Y-o-Y Growth (%), and Market Share (%) |
| 11.2.1.Large |
| 11.2.2.Medium |
| 11.2.3.Small |
| 11.3. Components Analysis 2018-2022 and Forecast 2023-2029 by Sales Value USD Million, Y-o-Y Growth (%), and Market Share (%) |
| 11.3.1.Pivot Points |
| 11.3.2.Control Panels |
| 11.3.3.Span |
| 11.3.4.Sprinkler Drop |
| 11.3.5.Drive Train |
| 11.3.6.Tower Drive Wheels |
| 11.4. Motion Analysis 2018-2022 and Forecast 2023-2029 by Sales Value USD Million, Y-o-Y Growth (%), and Market Share (%) |
| 11.4.1.Mobile |
| 11.4.2.Immobile |
| 11.5. Country Analysis 2018-2022 and Forecast 2023-2029 by Sales Value USD Million, Y-o-Y Growth (%), and Market Share (%) |
| 12.2. Size of field Analysis 2018-2022 and Forecast 2023-2029 by Sales Value USD Million, Y-o-Y Growth (%), and Market Share (%) |
| 12.2.1.Large |
| 12.2.2.Medium |
| 12.2.3.Small |
| 12.3. Components Analysis 2018-2022 and Forecast 2023-2029 by Sales Value USD Million, Y-o-Y Growth (%), and Market Share (%) |
| 12.3.1.Pivot Points |
| 12.3.2.Control Panels |
| 12.3.3.Span |
| 12.3.4.Sprinkler Drop |
| 12.3.5.Drive Train |
| 12.3.6.Tower Drive Wheels |
| 12.4. Motion Analysis 2018-2022 and Forecast 2023-2029 by Sales Value USD Million, Y-o-Y Growth (%), and Market Share (%) |
| 12.4.1.Mobile |
| 12.4.2.Immobile |
| 12.5. Country Analysis 2018-2022 and Forecast 2023-2029 by Sales Value USD Million, Y-o-Y Growth (%), and Market Share (%) |
| 13.2. Size of field Analysis 2018-2022 and Forecast 2023-2029 by Sales Value USD Million, Y-o-Y Growth (%), and Market Share (%) |
| 13.2.1.Large |
| 13.2.2.Medium |
| 13.2.3.Small |
| 13.3. Components Analysis 2018-2022 and Forecast 2023-2029 by Sales Value USD Million, Y-o-Y Growth (%), and Market Share (%) |
| 13.3.1.Pivot Points |
| 13.3.2.Control Panels |
| 13.3.3.Span |
| 13.3.4.Sprinkler Drop |
| 13.3.5.Drive Train |
| 13.3.6.Tower Drive Wheels |
| 13.4. Motion Analysis 2018-2022 and Forecast 2023-2029 by Sales Value USD Million, Y-o-Y Growth (%), and Market Share (%) |
| 13.4.1.Mobile |
| 13.4.2.Immobile |
| 13.5. Country Analysis 2018-2022 and Forecast 2023-2029 by Sales Value USD Million, Y-o-Y Growth (%), and Market Share (%) |
| 14.2. Size of field Analysis 2018-2022 and Forecast 2023-2029 by Sales Value USD Million, Y-o-Y Growth (%), and Market Share (%) |
| 14.2.1.Large |
| 14.2.2.Medium |
| 14.2.3.Small |
| 14.3. Components Analysis 2018-2022 and Forecast 2023-2029 by Sales Value USD Million, Y-o-Y Growth (%), and Market Share (%) |
| 14.3.1.Pivot Points |
| 14.3.2.Control Panels |
| 14.3.3.Span |
| 14.3.4.Sprinkler Drop |
| 14.3.5.Drive Train |
| 14.3.6.Tower Drive Wheels |
| 14.4. Motion Analysis 2018-2022 and Forecast 2023-2029 by Sales Value USD Million, Y-o-Y Growth (%), and Market Share (%) |
| 14.4.1.Mobile |
| 14.4.2.Immobile |
| 14.5. Country Analysis 2018-2022 and Forecast 2023-2029 by Sales Value USD Million, Y-o-Y Growth (%), and Market Share (%) |
| 15. Competition Landscape |
| 15.1. Market Player Profiles (Introduction, Brand/Product Sales, Financial Analysis, Product Offerings, Key Developments, Collaborations, M & A, Strategies, and SWOT Analysis) |
| 15.2.1.Valmont Industries, Incorporated |
| 15.2.2.Bauer GmbH, Roehren- und-Pumpenwork |
| 15.2.3.Lindsay Corporation |
| 15.2.4.Reinke Manufacturing Company, Incorporated |
| 15.2.5.T-L Irrigation Company |
| 15.2.6.Alkhorayef Group |
| 15.2.7.Grupo Fockink |
| 15.2.8.Rainfine (Dalian) Irrigation Company, Limited |
| 16. Research Methodology |
| 17. Appendix and Abbreviations |
- Valmont Industries, Incorporated
- Bauer GmbH, Roehren- und-Pumpenwork
- Lindsay Corporation
- Reinke Manufacturing Company, Incorporated
- T-L Irrigation Company
- Alkhorayef Group
- Grupo Fockink
- Rainfine (Dalian) Irrigation Company, Limited
