- Disease Modifying Anti Rheumatic Drugs
- Synthetic
- Biologic
- Non Steroidal Anti Inflammatory Drugs (NSAIDs)
- Corticosteroids
- Others
Rheumatology Therapeutics Market size was estimated at USD 24,568.4 million in 2022 and is poised to grow at a significant CAGR of 4.2% from 2023-2029. Rheumatology is the branch of medicine devoted to diagnosis and treatment of rheumatic diseases. Rheumatology diseases mainly affect the connecting and supporting parts of the body such as ligaments, joints, muscles, tendons and rarely some organs of the body.There are more than 100 types of rheumatic diseases are present but more common are psoriatic arthritis, ankylosing spondylitis, systemic lupus erythematosus, rheumatoid arthritis and others. Rheumatology diseases can be caused by various factors such as change in lifestyle, aging, unhealthy food and even genetic factors. The treatment is generally given with disease modifying anti rheumatic drugs and other drugs may be used to decrease the symptoms. The market is highly competitive due to the presence of the strong market players involving in development of new rheumatology therapeutics. Companies are developing the novel drugs and expanding the therapeutic applications of existing drugs.
For instance, in January 2016, Novartis AG has got two U.S. Food and Drug Administration approvals for its County to treat ankylosing spondylitis and psoriatic arthritis in U.S. in May 2017, Sanofi S.A. has got U.S. Food and Drug Administration approval for its kevazara (sarilumab) to treat active rheumatoid arthritis. Furthermore, companies also focusing on inorganic growth through acquisitions and mergers. For instance, in April 2016, Bristol Myers Squib acquired the Padlock Therapeutics Inc. along with the pipeline of rheumatoid arthritis and autoimmune drug pipeline to strengthen their market position.
Rheumatology Therapeutics Market Summary
Study Period
2024-2030
Base Year
2023
CAGR
4.2%
Largest Market
North America
Fastest Growing Market
Asia Pacific
Rheumatology Therapeutics Market Dynamics
Continuous growth in aging population, rise in prevalence of the diseases such as rheumatoid arthritis, ankylosing spondylitis and increase in R&D activities by the companies to develop new rheumatology therapeutics projected as primary drivers for the global rheumatology therapeutics market. In addition, rise in awareness related to symptoms and treatment of rheumatological disorders coupled with the recent product launches are expected to bolster the market growth over the forecast period. However, availability of the biosimilars, and patent expiry of some drugs is expected to hamper the global rheumatology therapeutics market during the coming years.
Key Features of the Reports
- The rheumatology therapeutics market report provides granular level information about the market size, regional market share, historic market and forecast.
- The report covers in-detail insights about the competitors overview, company share analysis, key market developments, and their key strategies
- The report outlines drivers, restraints, unmet needs, and trends that are currently affecting the market
- The report tracks recent innovations, key developments and startups details that are actively working in the market
- The report provides plethora of information about market entry strategies, regulatory framework and reimbursement scenario
- The report analyses the impact of socio-political environment through PESTLE Analysis and competition through Porters Five Force Analysis in addition to recent technology advancements and innovations in the market

Rheumatology Therapeutics Market Segmentation
By Drug Class
By Disorder
- Rheumatoid Arthritis
- Gout
- Ankylosing Spondylitis
- Osteo Arthritis
- Others
By Route of Administration
- Oral
- Parenteral
- Topical
By Distribution Channel
- Hospital Pharmacies
- Retail Pharmacies
- Online Pharmacies
By Geography
- North America
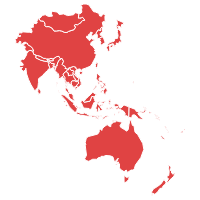
- Asia Pacific
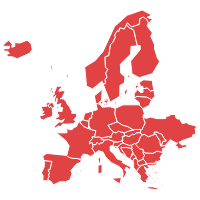
- Europe
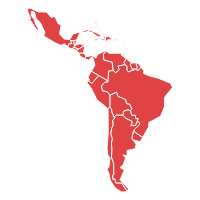
- Latin America
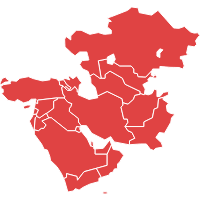
- Middle East and Africa
Frequently Asked Questions
The rheumatology therapeutics market size was valued at USD 24,568.4 million in 2022.
The key segments covered in the Rheumatology therapeutics market are technology, components, application, and end-users.
The Rheumatology therapeutics market key players AbbVie, Inc. (U.S.), Pfizer Inc. (U.S.), Bristol-Myers Squibb (U.S.), Merck & Co. (U.S.), Amgen, Inc. (U.S.), Janssen Biotech, Inc. (Johnson & Johnson), Novartis AG (Switzerland), Genentech, Inc. (U.S.), Sanofi S.A. (France), Takeda Pharmaceutical (Japan), Celgene Corporation (U.S.), Flexion Therapeutics, Inc. (U.S.)
| 1.Executive Summary |
| 2.Global Rheumatology Therapeutics Market Introduction |
| 2.1.Global Rheumatology Therapeutics Market - Taxonomy |
| 2.2.Global Rheumatology Therapeutics Market - Definitions |
| 2.2.1.Drug Class |
| 2.2.2.Disorder |
| 2.2.3.Route of Administration |
| 2.2.4.Distribution Channel |
| 2.2.5.Region |
| 3.Global Rheumatology Therapeutics Market Dynamics |
| 3.1. Drivers |
| 3.2. Restraints |
| 3.3. Opportunities/Unmet Needs of the Market |
| 3.4. Trends |
| 3.5. Product Landscape |
| 3.6. New Product Launches |
| 3.7. Impact of COVID 19 on Market |
| 4.Global Rheumatology Therapeutics Market Analysis, 2018 - 2022 and Forecast 2023 - 2029 |
| 4.1. Market Analysis, 2018 - 2022 and Forecast, 2023 - 2029, (Sales Value USD Million) |
| 4.2. Year-Over-Year (Y-o-Y) Growth Analysis (%) |
| 4.3. Market Opportunity Analysis |
| 5.Global Rheumatology Therapeutics Market By Drug Class, 2018 - 2022 and Forecast 2023 - 2029 (Sales Value USD Million) |
| 5.1. Disease Modifying Anti Rheumatic Drugs |
| 5.1.1. Market Analysis, 2018 - 2022 and Forecast, 2023 - 2029, (Sales Value USD Million) |
| 5.1.2. Year-Over-Year (Y-o-Y) Growth Analysis (%) and Market Share Analysis (%) |
| 5.1.3. Market Opportunity Analysis |
| 5.2. Non Steroidal Anti Inflammatory Drugs (NSAIDs) |
| 5.2.1. Market Analysis, 2018 - 2022 and Forecast, 2023 - 2029, (Sales Value USD Million) |
| 5.2.2. Year-Over-Year (Y-o-Y) Growth Analysis (%) and Market Share Analysis (%) |
| 5.2.3. Market Opportunity Analysis |
| 5.3. Corticosteroids |
| 5.3.1. Market Analysis, 2018 - 2022 and Forecast, 2023 - 2029, (Sales Value USD Million) |
| 5.3.2. Year-Over-Year (Y-o-Y) Growth Analysis (%) and Market Share Analysis (%) |
| 5.3.3. Market Opportunity Analysis |
| 5.4. Others |
| 5.4.1. Market Analysis, 2018 - 2022 and Forecast, 2023 - 2029, (Sales Value USD Million) |
| 5.4.2. Year-Over-Year (Y-o-Y) Growth Analysis (%) and Market Share Analysis (%) |
| 5.4.3. Market Opportunity Analysis |
| 6.Global Rheumatology Therapeutics Market By Disorder, 2018 - 2022 and Forecast 2023 - 2029 (Sales Value USD Million) |
| 6.1. Rheumatoid Arthritis |
| 6.1.1. Market Analysis, 2018 - 2022 and Forecast, 2023 - 2029, (Sales Value USD Million) |
| 6.1.2. Year-Over-Year (Y-o-Y) Growth Analysis (%) and Market Share Analysis (%) |
| 6.1.3. Market Opportunity Analysis |
| 6.2. Gout |
| 6.2.1. Market Analysis, 2018 - 2022 and Forecast, 2023 - 2029, (Sales Value USD Million) |
| 6.2.2. Year-Over-Year (Y-o-Y) Growth Analysis (%) and Market Share Analysis (%) |
| 6.2.3. Market Opportunity Analysis |
| 6.3. Ankylosing Spondylitis |
| 6.3.1. Market Analysis, 2018 - 2022 and Forecast, 2023 - 2029, (Sales Value USD Million) |
| 6.3.2. Year-Over-Year (Y-o-Y) Growth Analysis (%) and Market Share Analysis (%) |
| 6.3.3. Market Opportunity Analysis |
| 6.4. Osteo Arthritis |
| 6.4.1. Market Analysis, 2018 - 2022 and Forecast, 2023 - 2029, (Sales Value USD Million) |
| 6.4.2. Year-Over-Year (Y-o-Y) Growth Analysis (%) and Market Share Analysis (%) |
| 6.4.3. Market Opportunity Analysis |
| 6.5. Others |
| 6.5.1. Market Analysis, 2018 - 2022 and Forecast, 2023 - 2029, (Sales Value USD Million) |
| 6.5.2. Year-Over-Year (Y-o-Y) Growth Analysis (%) and Market Share Analysis (%) |
| 6.5.3. Market Opportunity Analysis |
| 7.Global Rheumatology Therapeutics Market By Route of Administration, 2018 - 2022 and Forecast 2023 - 2029 (Sales Value USD Million) |
| 7.1. Oral |
| 7.1.1. Market Analysis, 2018 - 2022 and Forecast, 2023 - 2029, (Sales Value USD Million) |
| 7.1.2. Year-Over-Year (Y-o-Y) Growth Analysis (%) and Market Share Analysis (%) |
| 7.1.3. Market Opportunity Analysis |
| 7.2. Parenteral |
| 7.2.1. Market Analysis, 2018 - 2022 and Forecast, 2023 - 2029, (Sales Value USD Million) |
| 7.2.2. Year-Over-Year (Y-o-Y) Growth Analysis (%) and Market Share Analysis (%) |
| 7.2.3. Market Opportunity Analysis |
| 7.3. Topical |
| 7.3.1. Market Analysis, 2018 - 2022 and Forecast, 2023 - 2029, (Sales Value USD Million) |
| 7.3.2. Year-Over-Year (Y-o-Y) Growth Analysis (%) and Market Share Analysis (%) |
| 7.3.3. Market Opportunity Analysis |
| 8.Global Rheumatology Therapeutics Market By Distribution Channel, 2018 - 2022 and Forecast 2023 - 2029 (Sales Value USD Million) |
| 8.1. Hospital Pharmacies |
| 8.1.1. Market Analysis, 2018 - 2022 and Forecast, 2023 - 2029, (Sales Value USD Million) |
| 8.1.2. Year-Over-Year (Y-o-Y) Growth Analysis (%) and Market Share Analysis (%) |
| 8.1.3. Market Opportunity Analysis |
| 8.2. Retail Pharmacies |
| 8.2.1. Market Analysis, 2018 - 2022 and Forecast, 2023 - 2029, (Sales Value USD Million) |
| 8.2.2. Year-Over-Year (Y-o-Y) Growth Analysis (%) and Market Share Analysis (%) |
| 8.2.3. Market Opportunity Analysis |
| 8.3. Online Pharmacies |
| 8.3.1. Market Analysis, 2018 - 2022 and Forecast, 2023 - 2029, (Sales Value USD Million) |
| 8.3.2. Year-Over-Year (Y-o-Y) Growth Analysis (%) and Market Share Analysis (%) |
| 8.3.3. Market Opportunity Analysis |
| 9.Global Rheumatology Therapeutics Market By Region, 2018 - 2022 and Forecast 2023 - 2029 (Sales Value USD Million) |
| 9.1. North America |
| 9.1.1. Market Analysis, 2018 - 2022 and Forecast, 2023 - 2029, (Sales Value USD Million) |
| 9.1.2. Year-Over-Year (Y-o-Y) Growth Analysis (%) and Market Share Analysis (%) |
| 9.1.3. Market Opportunity Analysis |
| 9.2. Europe |
| 9.2.1. Market Analysis, 2018 - 2022 and Forecast, 2023 - 2029, (Sales Value USD Million) |
| 9.2.2. Year-Over-Year (Y-o-Y) Growth Analysis (%) and Market Share Analysis (%) |
| 9.2.3. Market Opportunity Analysis |
| 9.3. Asia Pacific (APAC) |
| 9.3.1. Market Analysis, 2018 - 2022 and Forecast, 2023 - 2029, (Sales Value USD Million) |
| 9.3.2. Year-Over-Year (Y-o-Y) Growth Analysis (%) and Market Share Analysis (%) |
| 9.3.3. Market Opportunity Analysis |
| 9.4. Middle East and Africa (MEA) |
| 9.4.1. Market Analysis, 2018 - 2022 and Forecast, 2023 - 2029, (Sales Value USD Million) |
| 9.4.2. Year-Over-Year (Y-o-Y) Growth Analysis (%) and Market Share Analysis (%) |
| 9.4.3. Market Opportunity Analysis |
| 9.5. Latin America |
| 9.5.1. Market Analysis, 2018 - 2022 and Forecast, 2023 - 2029, (Sales Value USD Million) |
| 9.5.2. Year-Over-Year (Y-o-Y) Growth Analysis (%) and Market Share Analysis (%) |
| 9.5.3. Market Opportunity Analysis |
| 10.North America Rheumatology Therapeutics Market ,2018 - 2022 and Forecast 2023 - 2029 (Sales Value USD Million) |
| 10.1. Drug Class Analysis 2018 - 2022 and Forecast 2023 - 2029 by Sales Value USD Million, Y-o-Y Growth (%), and Market Share (%) |
| 10.1.1.Disease Modifying Anti Rheumatic Drugs |
| 10.1.2.Non Steroidal Anti Inflammatory Drugs (NSAIDs) |
| 10.1.3.Corticosteroids |
| 10.1.4.Others |
| 10.2. Disorder Analysis 2018 - 2022 and Forecast 2023 - 2029 by Sales Value USD Million, Y-o-Y Growth (%), and Market Share (%) |
| 10.2.1.Rheumatoid Arthritis |
| 10.2.2.Gout |
| 10.2.3.Ankylosing Spondylitis |
| 10.2.4.Osteo Arthritis |
| 10.2.5.Others |
| 10.3. Route of Administration Analysis 2018 - 2022 and Forecast 2023 - 2029 by Sales Value USD Million, Y-o-Y Growth (%), and Market Share (%) |
| 10.3.1.Oral |
| 10.3.2.Parenteral |
| 10.3.3.Topical |
| 10.4. Distribution Channel Analysis 2018 - 2022 and Forecast 2023 - 2029 by Sales Value USD Million, Y-o-Y Growth (%), and Market Share (%) |
| 10.4.1.Hospital Pharmacies |
| 10.4.2.Retail Pharmacies |
| 10.4.3.Online Pharmacies |
| 10.5. Country Analysis 2018 - 2022 and Forecast 2023 - 2029 by Sales Value USD Million, Y-o-Y Growth (%), and Market Share (%) |
| 10.5.1.United States of America (USA) |
| 10.5.2.Canada |
| 11.Europe Rheumatology Therapeutics Market ,2018 - 2022 and Forecast 2023 - 2029 (Sales Value USD Million) |
| 11.1. Drug Class Analysis and Forecast by Sales Value USD Million, Y-o-Y Growth (%), and Market Share (%) |
| 11.1.1.Disease Modifying Anti Rheumatic Drugs |
| 11.1.2.Non Steroidal Anti Inflammatory Drugs (NSAIDs) |
| 11.1.3.Corticosteroids |
| 11.1.4.Others |
| 11.2. Disorder Analysis 2018 - 2022 and Forecast 2023 - 2029 by Sales Value USD Million, Y-o-Y Growth (%), and Market Share (%) |
| 11.2.1.Rheumatoid Arthritis |
| 11.2.2.Gout |
| 11.2.3.Ankylosing Spondylitis |
| 11.2.4.Osteo Arthritis |
| 11.2.5.Others |
| 11.3. Route of Administration Analysis 2018 - 2022 and Forecast 2023 - 2029 by Sales Value USD Million, Y-o-Y Growth (%), and Market Share (%) |
| 11.3.1.Oral |
| 11.3.2.Parenteral |
| 11.3.3.Topical |
| 11.4. Distribution Channel Analysis 2018 - 2022 and Forecast 2023 - 2029 by Sales Value USD Million, Y-o-Y Growth (%), and Market Share (%) |
| 11.4.1.Hospital Pharmacies |
| 11.4.2.Retail Pharmacies |
| 11.4.3.Online Pharmacies |
| 11.5. Country Analysis 2018 - 2022 and Forecast 2023 - 2029 by Sales Value USD Million, Y-o-Y Growth (%), and Market Share (%) |
| 11.5.1.Germany |
| 11.5.2.France |
| 11.5.3.Italy |
| 11.5.4.United Kingdom (UK) |
| 11.5.5.Spain |
| 11.5.6.Rest of EU |
| 12.Asia Pacific (APAC) Rheumatology Therapeutics Market ,2018 - 2022 and Forecast 2023 - 2029 (Sales Value USD Million) |
| 12.1. Drug Class Analysis and Forecast by Sales Value USD Million, Y-o-Y Growth (%), and Market Share (%) |
| 12.1.1.Disease Modifying Anti Rheumatic Drugs |
| 12.1.2.Non Steroidal Anti Inflammatory Drugs (NSAIDs) |
| 12.1.3.Corticosteroids |
| 12.1.4.Others |
| 12.2. Disorder Analysis 2018 - 2022 and Forecast 2023 - 2029 by Sales Value USD Million, Y-o-Y Growth (%), and Market Share (%) |
| 12.2.1.Rheumatoid Arthritis |
| 12.2.2.Gout |
| 12.2.3.Ankylosing Spondylitis |
| 12.2.4.Osteo Arthritis |
| 12.2.5.Others |
| 12.3. Route of Administration Analysis 2018 - 2022 and Forecast 2023 - 2029 by Sales Value USD Million, Y-o-Y Growth (%), and Market Share (%) |
| 12.3.1.Oral |
| 12.3.2.Parenteral |
| 12.3.3.Topical |
| 12.4. Distribution Channel Analysis 2018 - 2022 and Forecast 2023 - 2029 by Sales Value USD Million, Y-o-Y Growth (%), and Market Share (%) |
| 12.4.1.Hospital Pharmacies |
| 12.4.2.Retail Pharmacies |
| 12.4.3.Online Pharmacies |
| 12.5. Country Analysis 2018 - 2022 and Forecast 2023 - 2029 by Sales Value USD Million, Y-o-Y Growth (%), and Market Share (%) |
| 12.5.1.China |
| 12.5.2.India |
| 12.5.3.Australia and New Zealand (ANZ) |
| 12.5.4.Japan |
| 12.5.5.Rest of APAC |
| 13.Middle East and Africa (MEA) Rheumatology Therapeutics Market ,2018 - 2022 and Forecast 2023 - 2029 (Sales Value USD Million) |
| 13.1. Drug Class Analysis and Forecast by Sales Value USD Million, Y-o-Y Growth (%), and Market Share (%) |
| 13.1.1.Disease Modifying Anti Rheumatic Drugs |
| 13.1.2.Non Steroidal Anti Inflammatory Drugs (NSAIDs) |
| 13.1.3.Corticosteroids |
| 13.1.4.Others |
| 13.2. Disorder Analysis 2018 - 2022 and Forecast 2023 - 2029 by Sales Value USD Million, Y-o-Y Growth (%), and Market Share (%) |
| 13.2.1.Rheumatoid Arthritis |
| 13.2.2.Gout |
| 13.2.3.Ankylosing Spondylitis |
| 13.2.4.Osteo Arthritis |
| 13.2.5.Others |
| 13.3. Route of Administration Analysis 2018 - 2022 and Forecast 2023 - 2029 by Sales Value USD Million, Y-o-Y Growth (%), and Market Share (%) |
| 13.3.1.Oral |
| 13.3.2.Parenteral |
| 13.3.3.Topical |
| 13.4. Distribution Channel Analysis 2018 - 2022 and Forecast 2023 - 2029 by Sales Value USD Million, Y-o-Y Growth (%), and Market Share (%) |
| 13.4.1.Hospital Pharmacies |
| 13.4.2.Retail Pharmacies |
| 13.4.3.Online Pharmacies |
| 13.5. Country Analysis 2018 - 2022 and Forecast 2023 - 2029 by Sales Value USD Million, Y-o-Y Growth (%), and Market Share (%) |
| 13.5.1.GCC Countries |
| 13.5.2.South Africa |
| 13.5.3.Rest of MEA |
| 14.Latin America Rheumatology Therapeutics Market ,2018 - 2022 and Forecast 2023 - 2029 (Sales Value USD Million) |
| 14.1. Drug Class Analysis and Forecast by Sales Value USD Million, Y-o-Y Growth (%), and Market Share (%) |
| 14.1.1.Disease Modifying Anti Rheumatic Drugs |
| 14.1.2.Non Steroidal Anti Inflammatory Drugs (NSAIDs) |
| 14.1.3.Corticosteroids |
| 14.1.4.Others |
| 14.2. Disorder Analysis 2018 - 2022 and Forecast 2023 - 2029 by Sales Value USD Million, Y-o-Y Growth (%), and Market Share (%) |
| 14.2.1.Rheumatoid Arthritis |
| 14.2.2.Gout |
| 14.2.3.Ankylosing Spondylitis |
| 14.2.4.Osteo Arthritis |
| 14.2.5.Others |
| 14.3. Route of Administration Analysis 2018 - 2022 and Forecast 2023 - 2029 by Sales Value USD Million, Y-o-Y Growth (%), and Market Share (%) |
| 14.3.1.Oral |
| 14.3.2.Parenteral |
| 14.3.3.Topical |
| 14.4. Distribution Channel Analysis 2018 - 2022 and Forecast 2023 - 2029 by Sales Value USD Million, Y-o-Y Growth (%), and Market Share (%) |
| 14.4.1.Hospital Pharmacies |
| 14.4.2.Retail Pharmacies |
| 14.4.3.Online Pharmacies |
| 14.5. Country Analysis 2018 - 2022 and Forecast 2023 - 2029 by Sales Value USD Million, Y-o-Y Growth (%), and Market Share (%) |
| 14.5.1.Brazil |
| 14.5.2.Mexico |
| 14.5.3.Rest of LA |
| 15. Competition Landscape |
| 15.1. Market Player Profiles (Introduction, Brand/Product Sales, Financial Analysis, Product Offerings, Key Developments, Collaborations, M & A, Strategies, and SWOT Analysis) |
| 15.2.1.AbbVie Inc (U.S) |
| 15.2.2.Pfizer Inc (U.S) |
| 15.2.3.Bristol-Myers Squibb (U.S) |
| 15.2.4.Merck & Co (U.S) |
| 15.2.5.Amgen Inc (U.S) |
| 15.2.6.Janssen Biotech Inc (Johnson & Johnson) |
| 15.2.7.Novartis AG (Switzerland) |
| 15.2.8.Genentech Inc (U.S) |
| 15.2.9.Sanofi S.A (France) |
| 15.2.10.Takeda Pharmaceutical (Japan) |
| 15.2.11.Celgene Corporation (U.S) |
| 15.2.12.Flexion Therapeutics Inc (U.S) |
| 16. Research Methodology |
| 17. Appendix and Abbreviations |
- AbbVie Inc (U.S)
- Pfizer Inc (U.S)
- Bristol-Myers Squibb (U.S)
- Merck & Co (U.S)
- Amgen Inc (U.S)
- Janssen Biotech Inc (Johnson & Johnson)
- Novartis AG (Switzerland)
- Genentech Inc (U.S)
- Sanofi S.A (France)
- Takeda Pharmaceutical (Japan)
- Celgene Corporation (U.S)
- Flexion Therapeutics Inc (U.S)
